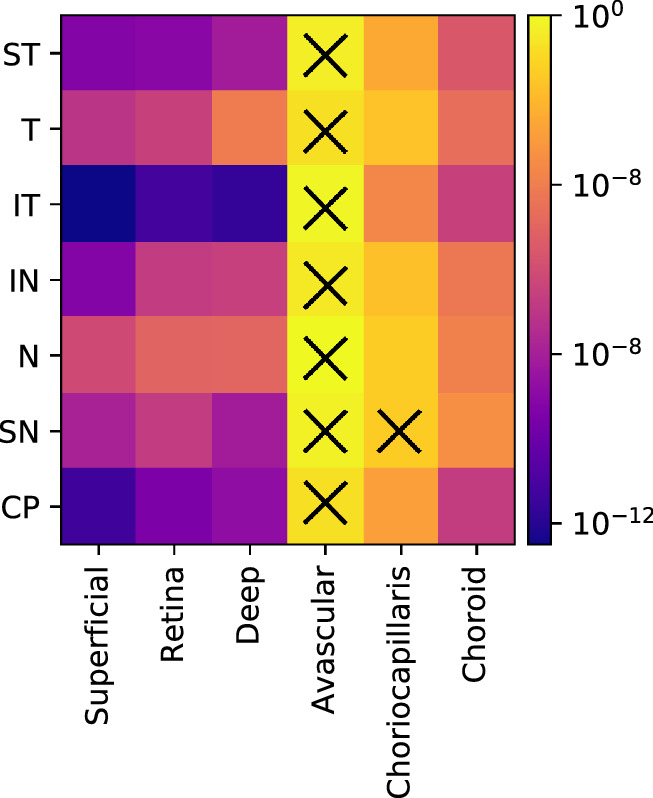
Figure 9.

Permutation test, p value, for each vascular feature between severity groups (healthy controls, mild, moderate, and severe glaucoma). The X symbol denotes the groups that did not present a statistically significant difference (P >0.05).

Permutation test, p value, for each vascular feature between severity groups (healthy controls, mild, moderate, and severe glaucoma). The X symbol denotes the groups that did not present a statistically significant difference (P >0.05).