Figure 5.

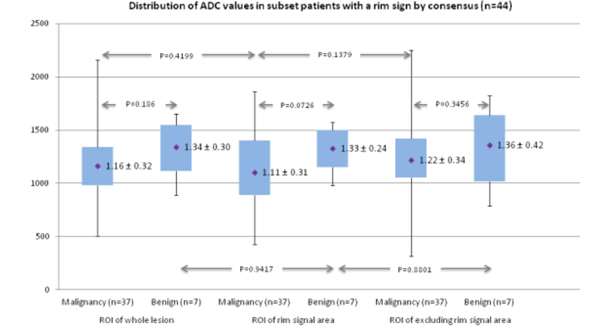
The graph shows the distribution of the mean apparent diffusion coefficient (ADCmean) values of the whole lesion, the rim signal area, and the area excluding the rim signal in a subset of patients (n = 44) with a rim sign by consensus.

The graph shows the distribution of the mean apparent diffusion coefficient (ADCmean) values of the whole lesion, the rim signal area, and the area excluding the rim signal in a subset of patients (n = 44) with a rim sign by consensus.