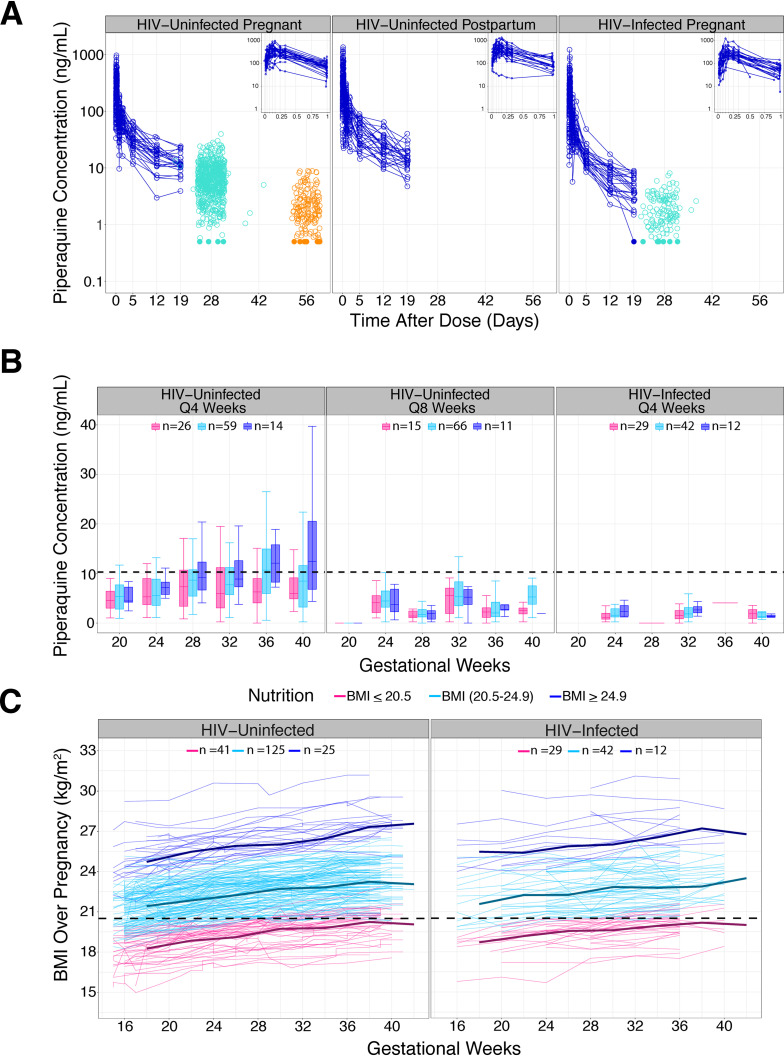
FIG 2.
Time profiles. (A) Piperaquine concentrations over time used to build the population PK model. The profiles in blue represent intensive PK sampling. Each line represents one individual. Monthly (28-day) concentrations are in green and 56-day trough concentrations are in orange. Insets in the upper right corner show the intensive PK profiles for the first day postdose. To avoid overlap of monthly points, random noise was added about the x axis to separate the data. (B) Piperaquine monthly concentrations stratified by treatment arm, HIV status, and BMI. Women were grouped based on gestational week-28 BMIs. The number of women in each group is displayed. The dashed line at 10.3 ng/ml marks the previously defined threshold for malaria protection in HIV-uninfected pregnant women. (C) BMI over time profile. Women were grouped based on week-28 BMIs. Each line represents one individual. The dashed line at 20.5 kg/m2 marks the plotting cutoff for defining a woman as malnourished during the third trimester (see the supplemental material).

