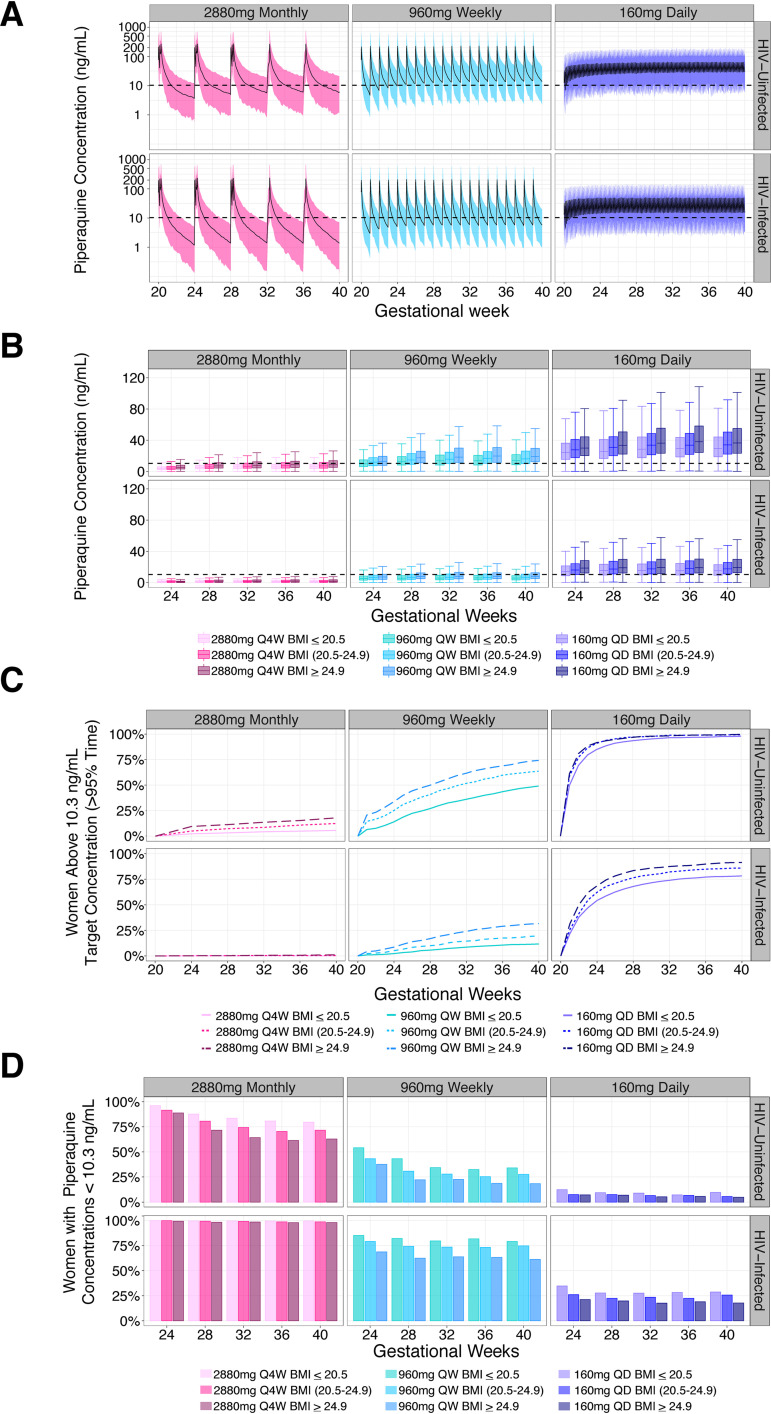
FIG 5.
Alternative IPTp regimen simulations. (A) Full PK profiles. Simulated PQ concentrations over pregnancy stratified based on HIV status for three different dosing regimens. The dashed line at 10.3 ng/ml marks the previously defined threshold for malaria protection in HIV-uninfected pregnant women. (B) Day-28 concentrations. Simulated PQ day-28 concentrations over pregnancy stratified based on HIV status and week-28 BMI. The dashed line at 10.3 ng/ml marks the previously defined threshold for malaria protection in pregnant women. (C) Percentage of women protected. Percentage of women achieving protection based on HIV status and week-28 BMI for different prevention regimens over pregnancy. Protection was defined as sustaining a PQ concentration of 10.3 ng/ml or greater for 95% of their pregnancy. (D) Percentage of women with day-28 concentrations below 10.3 ng/ml. Based on simulated PQ concentrations, the percentage of women not protected at the end of the month is stratified based on HIV status and week-28 BMI. Q4W, doses given every 4 weeks; QW, doses given every week; QD, doses given daily.

