FIG 3.
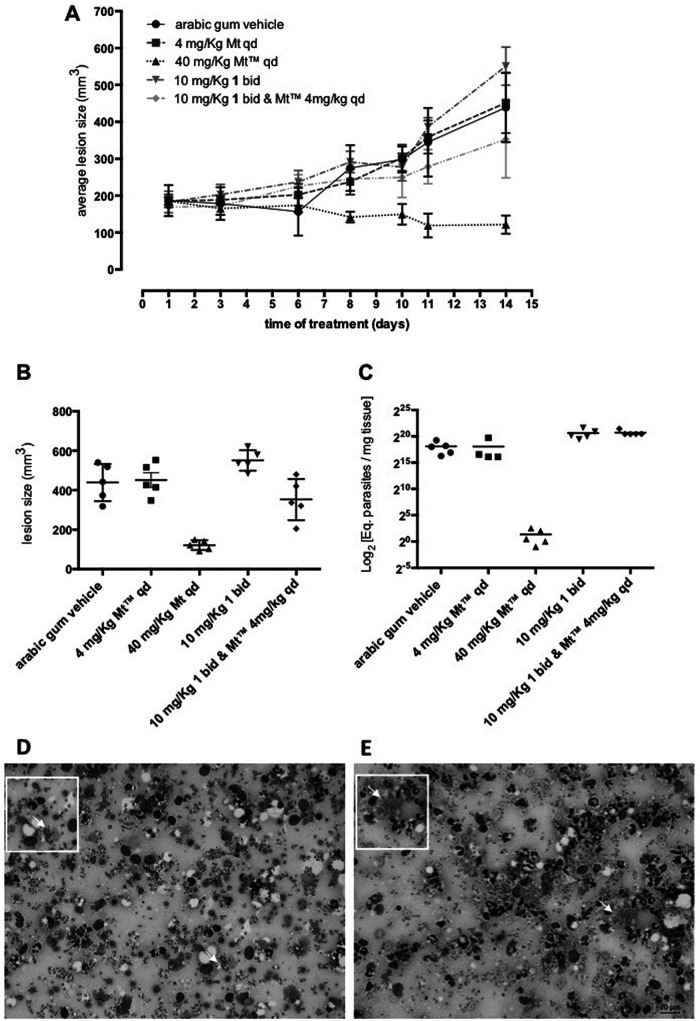
Activity of compound 1 in the L. amazonensis-BALBc model of CL. The graphics show average lesion size during treatment (A) and average lesion size (B) and parasite load by quantitative PCR (qPCR) at 31 days postinfection (C), according to each experimental group. Light microscopy of lesion imprints of infected mice treated with vehicle (D) and after oral (p.o.) administration of compound 1 at 10 mg/kg b.i.d. (E). Arrows indicates intracellular parasites.

