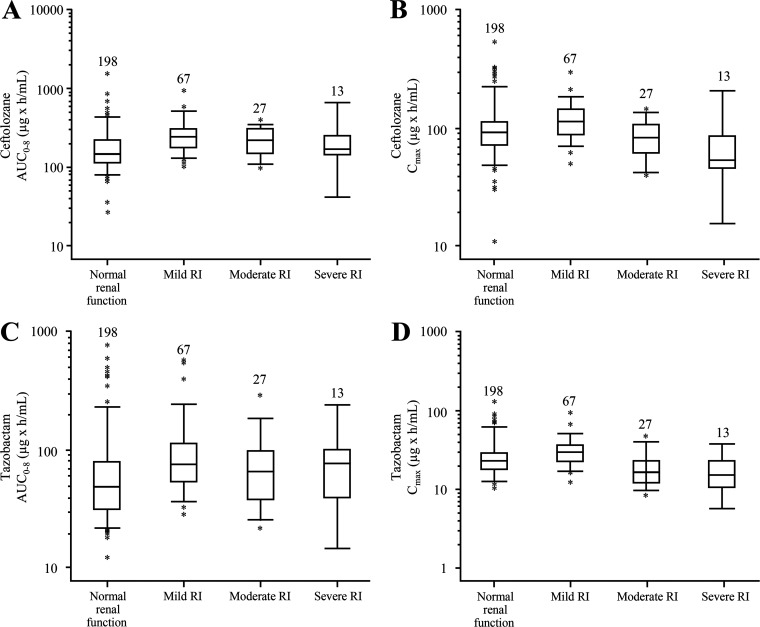
FIG 3.
Ceftolozane and tazobactam steady-state exposures by renal function group. (A to D) The ceftolozane AUC0–8 (A) and Cmax (B) and tazobactam AUC0–8 (C) and Cmax (D) are shown. Participants were classified by renal function groups as follows: normal renal function (CLCR, ≥80 ml/min), mild RI (CLCR, >50 to <80 ml/min), moderate RI (CLCR, ≥30 to ≤50 ml/min), and severe RI (CLCR, ≥15 to <30 ml/min). Boxes are the 25th, 50th, and 75th percentiles; whiskers are the 5th to 95th percentiles. Asterisks show data points outside this range. Participant numbers are indicated above each box. AUC0–8, area under the concentration-time curve for the first 8 h after dosing; CLCR, creatinine clearance; Cmax, maximum plasma concentration; RI, renal impairment.

