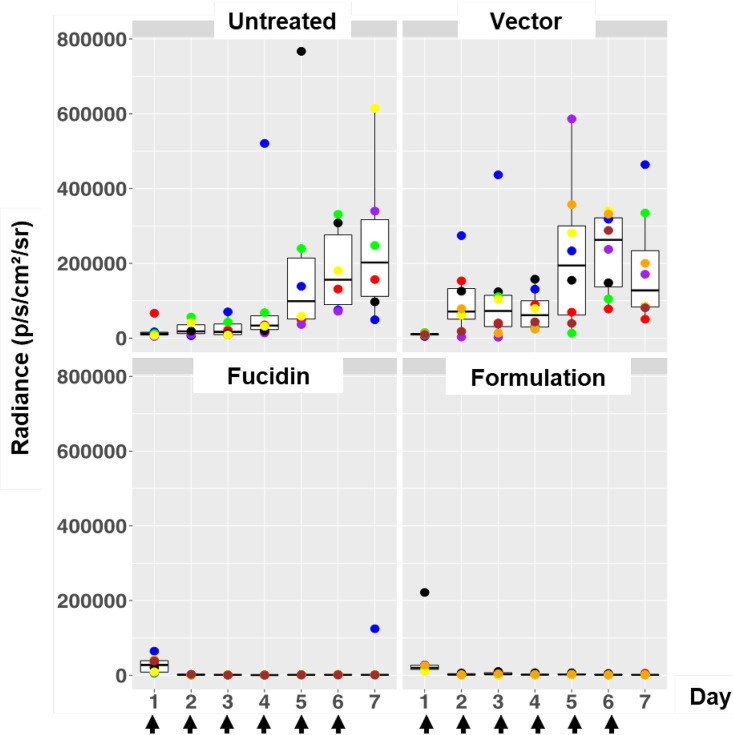
FIG 3.
Box plots of bioluminescent signal produced by MRSA ATCC 33591-lux in photons per second per square centimeter per steradian in differently treated mouse groups. The days of treatment with the formulation, Fucidin cream, and vector are indicated with arrows. Untreated mice were infected and left untreated. The area within each box represents the interquartile region (IQR), which comprises the second and third quartiles and describes the interval of values where the middle 50% of the observed data are distributed. The horizontal black line within each box represents the median value. The extent of the IQR (box height) express the degree of variability measured within the middle 50% of the observed data, with whiskers extending out at either side of the boxes marking the minimum and maximum observed values, as well as the variability outside the middle 50% of values (whisker length). Outliers are displayed as data that extend out of the whisker limit (1.5 times the IQR). The numbers of mice were 6 in the untreated group, 8 in the vector group, 8 in the Fucidin group, and 7 in the formulation group.

