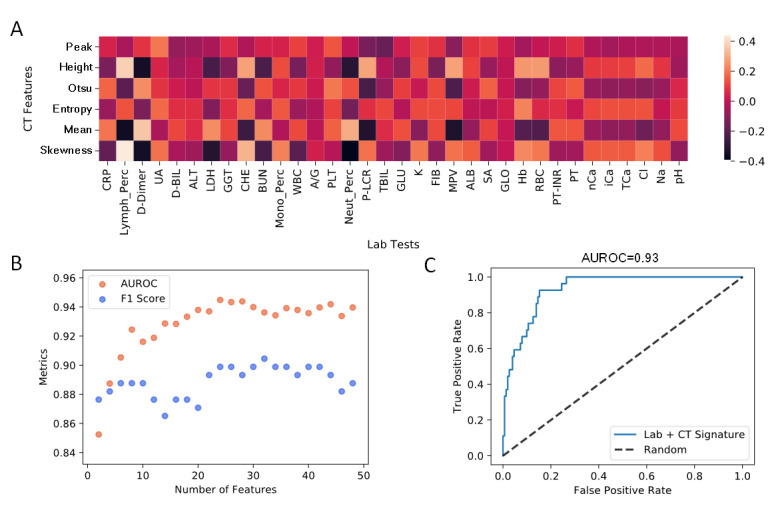
Figure 4.

Prediction based on computed tomography (CT) and laboratory features. (A) Spearman correlation heatmap between CT and laboratory features. “Peak” stands for peak location, and “height” stands for peak height. A summary table describing all CT and laboratory features and their abbreviations is provided in Multimedia Appendix 2. (B) Model accuracy metrics with an increased number of features. (C) Area under receiver operating characteristic of classification using a signature of 15 CT and laboratory features.
