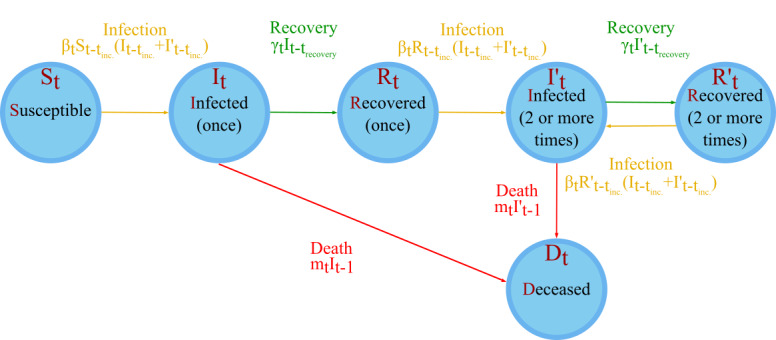
Figure 1.

A simple representation of the model. St represents the number of persons susceptible to infection who have had no prior infections on day t; It is the number of people currently infected for the first time on day t; Rt is the number of people who have recovered once on day t; I’t is the number of people who have been infected 2 or more times and are infected on day t; R’t is the number of people who have recovered 2 or more times and are not infected on day t of the model, and Dt is the number of deceased persons on day t of the model. Further symbols are defined in Table 1.
