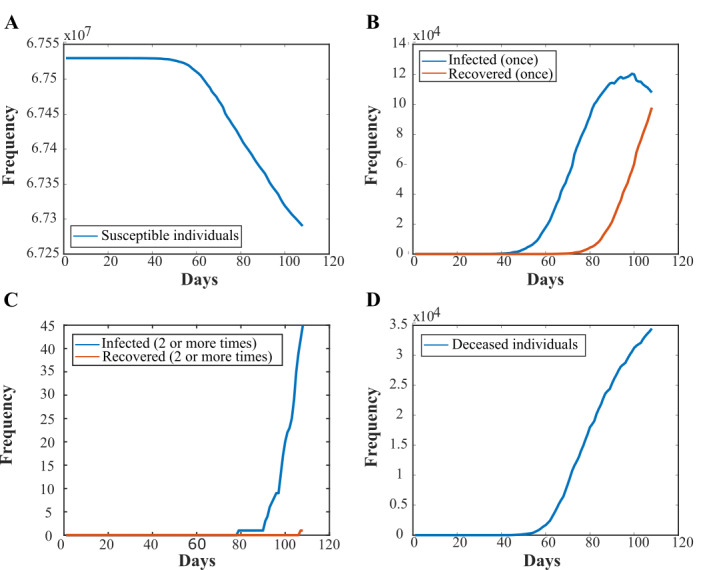
Figure 2.

Plots of the populations of each state in the model over the course of a typical simulation, using infection data from the United Kingdom. (A) An example plot of the susceptible population in the model over the course of 106 days (from the first recorded case on February 1 until May 17, 2020, when the data were accessed). (B) An example plot of the populations that are infected for the first time or recovered from a single infection. (C) An example plot of the populations of the simulation that have been reinfected and have recovered from an infection twice. (D) An example plot of the number of deceased individuals through the course of the simulation.
