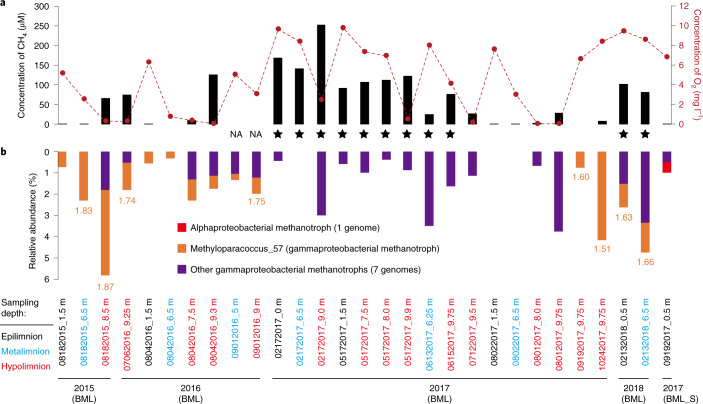
Fig. 1. Geochemical and biological evidence for methane oxidation in BML and BML_S samples.
a, The methane and oxygen concentrations at different depths at each sampling time point. Samples in which methanotrophs are inferred to be less active or inactive are indicated by stars. NA, not available. b, The relative abundances of methanotrophs. The iRep values (orange font) indicative of the growth rates of Methyloparacoccus_57 are shown; values for other methanotrophs are provided in Supplementary Fig. 2.

