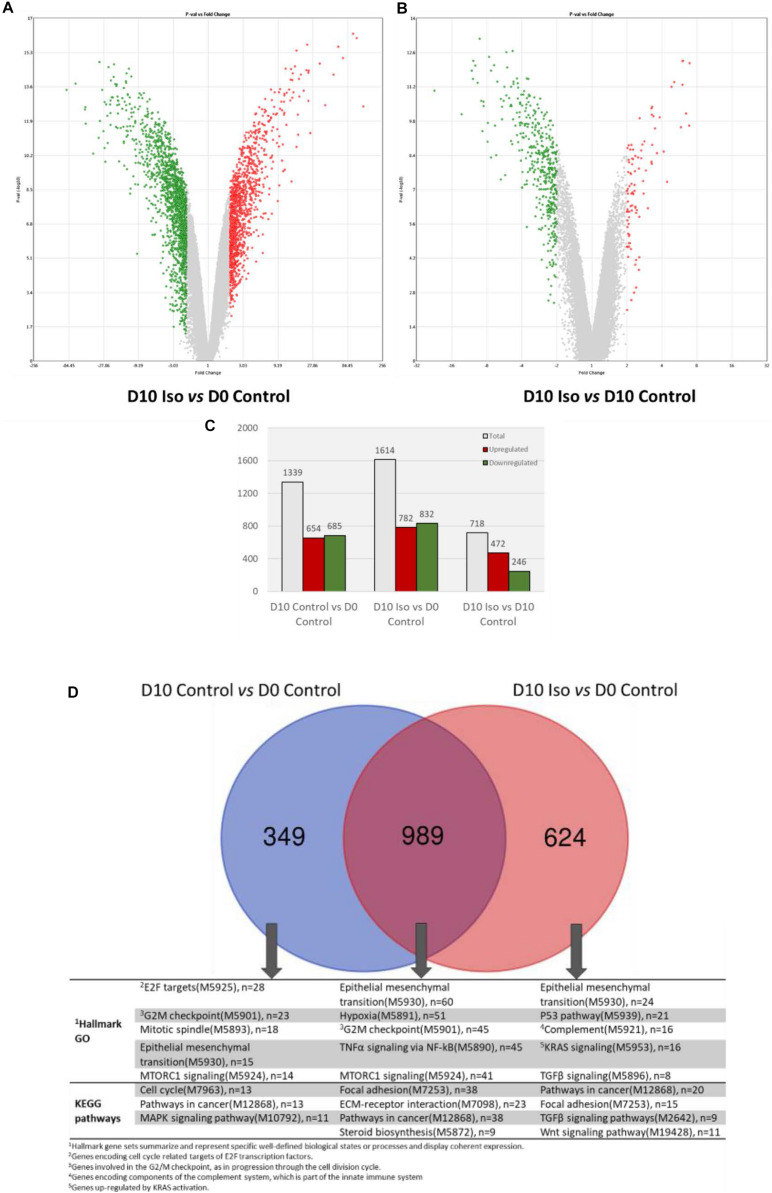
FIGURE 1.
Volcano plots showing DEGs (fold change >2, p value < 0.05) between (A) D10 isorhamnetin-treated and D0 control hAECs, and (B) D10 isorhamnetin-treated and D10 control hAECs. The Y-axis corresponds to –log10 p-value, and the X-axis displays linear fold change. The red dots represent the upregulated genes; the green dots represent the downregulated genes. (C) Bar graph showing number of DEGs in each treatment pair. (D) Venn diagram showing common and unique sets of DEGs between each exposure. Blue circle denotes DEGs between D10 and D0 controls; red circle denotes DEGs between D10 isorhamnetin-treated and D0 control hAECs. Iso, Isorhamnetin.

