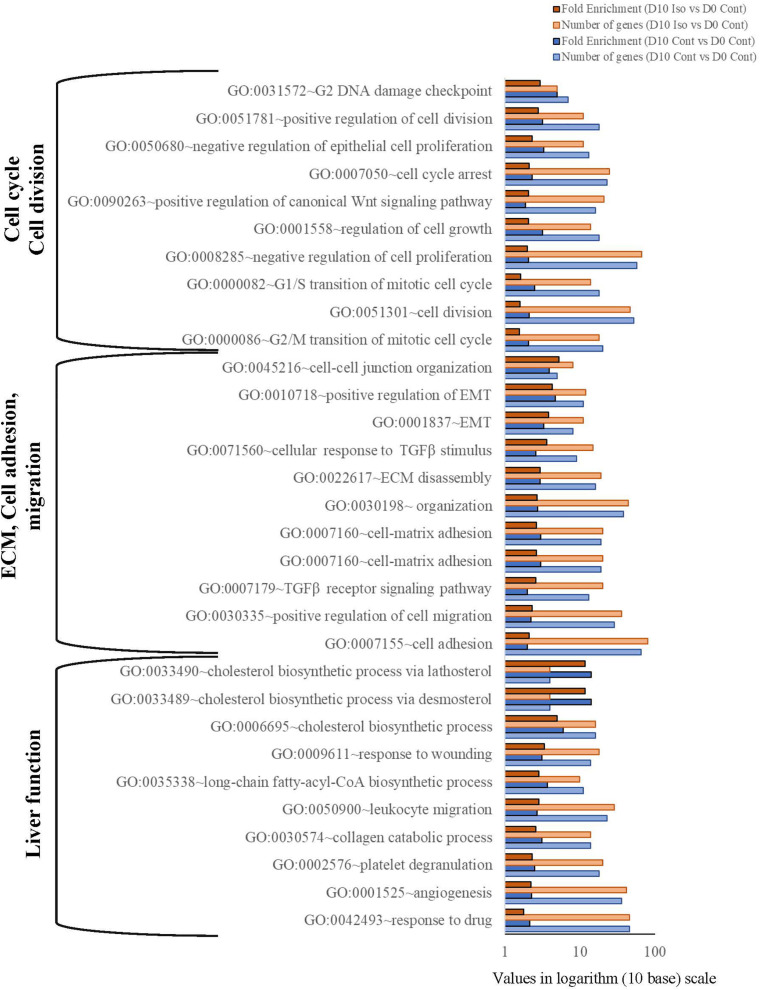
FIGURE 2.
Bar graph showing significantly enriched biological process gene ontology (p < 0.05; Modified Fisher’s Exact Test). Values are presented in logarithm (10 base) scale. Fold enrichment is calculated as the ratio of the two proportions: the proportion of genes associated with the GO category in a list of DEGs of a study and the proportion of genes associated with that GO in the human genome (DAVID online tool: https://david.ncifcrf.gov/home.jsp). Iso, Isorhamnetin; Cont, Control.

