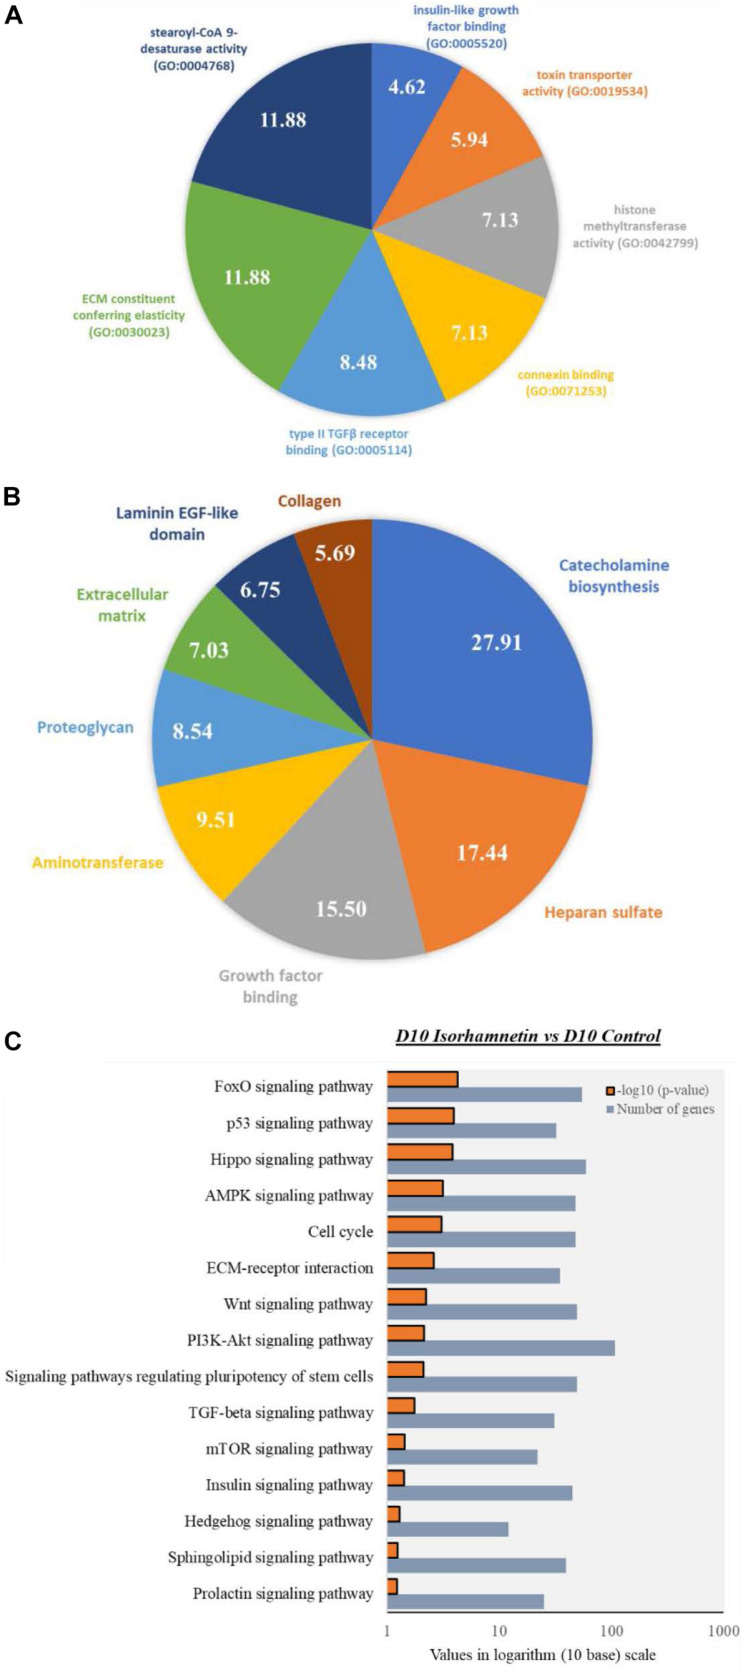
FIGURE 3.
Pie charts showing top significantly enriched (p < 0.05; Modified Fisher’s Exact Test) (A) Molecular function GOs by the DEGs between D10 isorhamnetin-treated and D0 control hAECs, and (B) Gene functional categories of the DEGs between D10 isorhamnetin-treated and D10 control hAECs. Fold enrichment values are presented in each corresponding pie. (C) Bar graph showing significantly enriched (p < 0.05; Modified Fisher’s Exact Test) top KEGG pathways by DEGs between D10 isorhamnetin-treated and D10 control hAECs. Values are presented in logarithm (10 base) scale.

