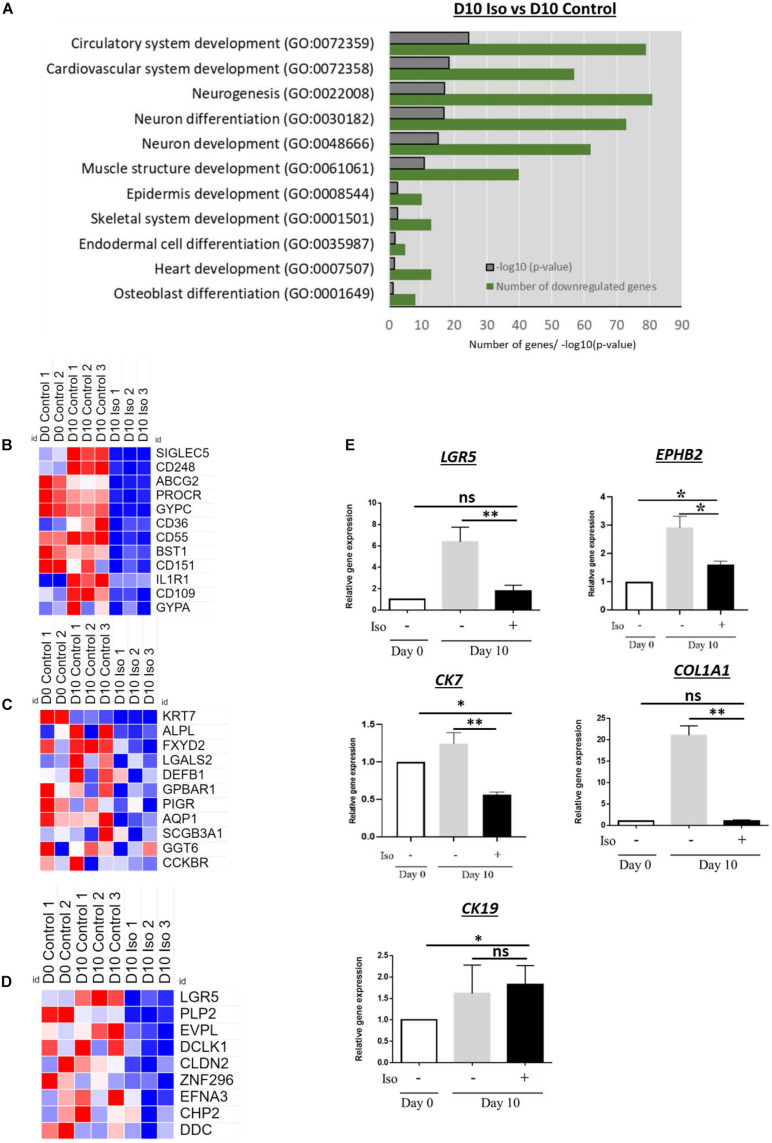
FIGURE 5.
(A) Bar graph showing significantly downregulated GO in D10 isorhamnetin-treated hAECs compared to D10 control. Heatmaps showing signal intensities (log2) of genes (from microarray analysis) related to (B) Transdifferentiation, (C) Cholangiocyte, and (D) Colon. (E) Relative expression levels of genes to trace transdifferentiation. *P < 0.05, **P < 0.01, ns: not significant.

