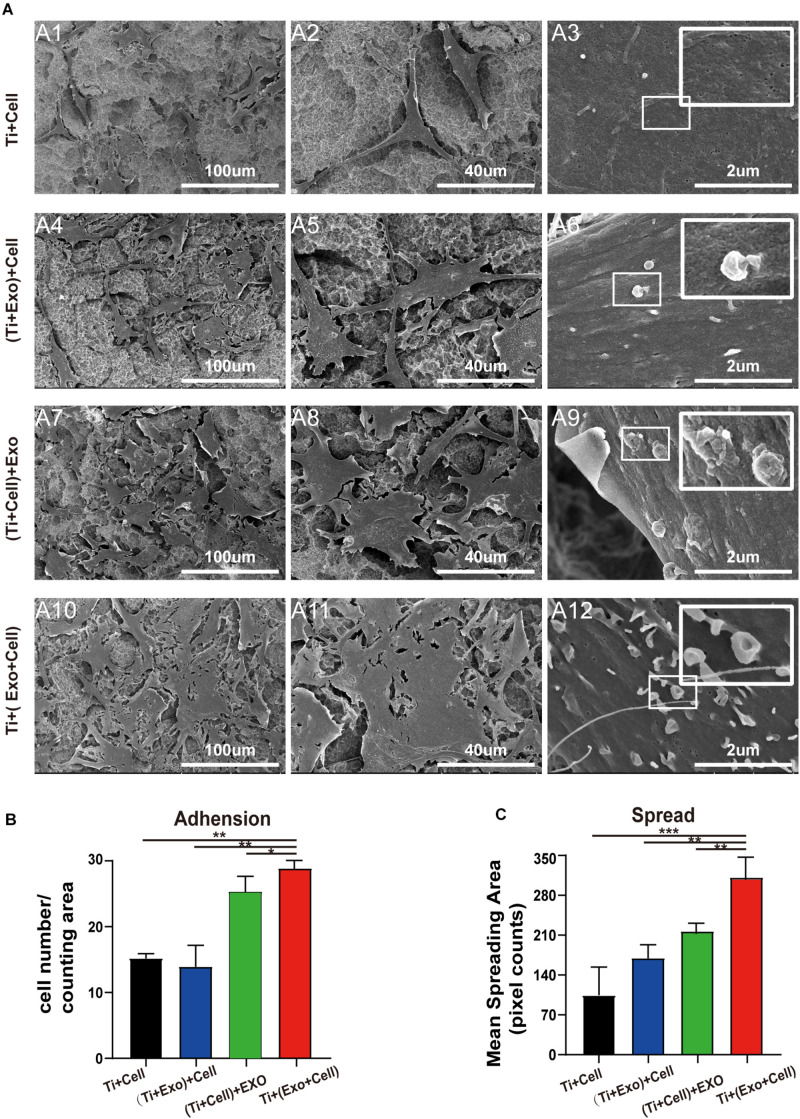
FIGURE 4.
SEM images of adherent rat bone marrow stem cells (rBMSCs) under different treatments of exosomes. (A) No exosomes appear on the control surface and adherent cells. In the Ti + (Exo + Cell) group, rBMSCs with longer and more numerous microvilli are detected in the presence of exosomes compared with the other three groups. The high-magnification image shows the endocytosis of exosomes by BMSCs (scale bar: A1, A4, A7, and A10, 100 μm; A2, A5, A8, and A11, 40 μm; A3, A6, A9, and A12, 2 μm). (B) The number of attached cells was counted under SEM. (C) The average steady-state spreading area of each rBMSC was quantified using ImageJ. The results are presented as the mean ± standard error of the mean, n = 3. *p < 0.05; **p < 0.01, ***p < 0.001. ns, not significant; Exo, exosomes.

