
Figure 2.
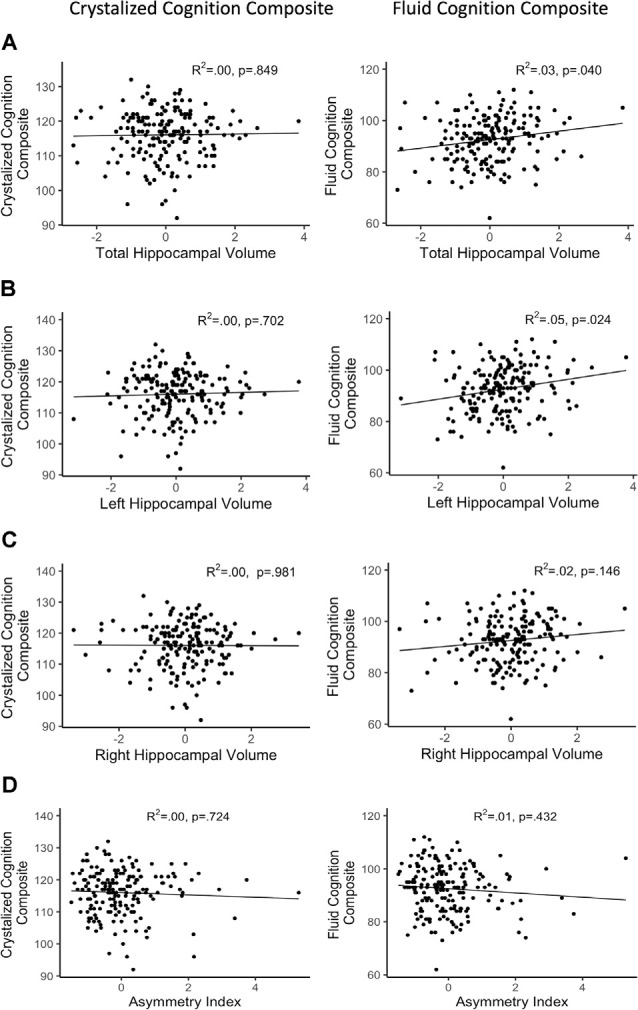
Regressions of hippocampal volume and NIHTB cognition composites. (A) Total hippocampal volume; (B) left hippocampal volume; (C) right hippocampal volume; (D) asymmetry index; R2 reflects variance explained from the partial correlation between hippocampal volume and NIHTB-CB score; X-axis = residual of hippocampal volume after controlling for sex, education, scanner, and total intracranial volume; Y-axis = standard score of NIHTB-CB variables.