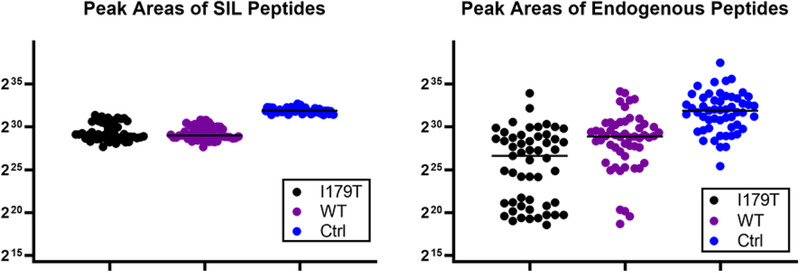
Figure 1.

SIL and Endogenous Peptide Presence. The levels, as determined by summation of MS2 peak integrations by Skyline, of each of the stable‐isotope labeled (SIL) and endogenous peptides are plotted across each of the 53 samples. The group medians are indicated with the black line. A) The SIL peptides were present in all the samples, as expected. They were used to aid in the detection, verification, and quantitation of the corresponding endogenous peptides. The SIL control peptide was also used to back calculate absolute amounts of PSA. B) The endogenous peptides were more variable across the samples which is expected based on person‐to‐person variability.
