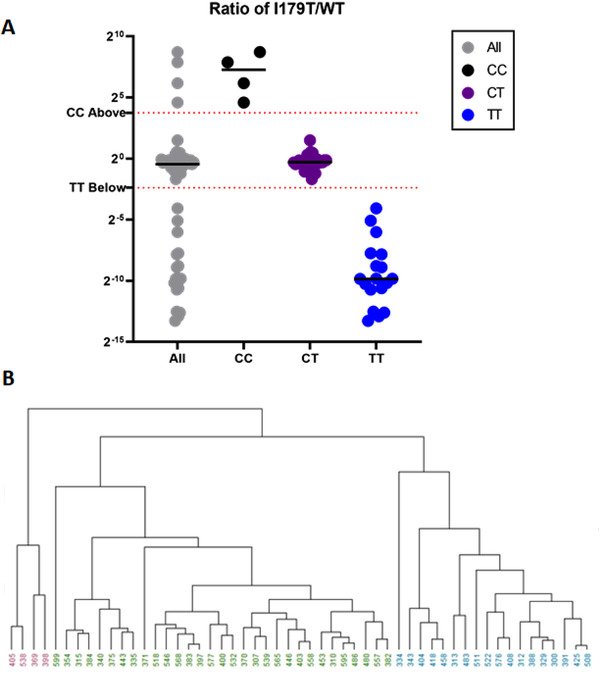
Figure 2.

Grouping and Clustering for Genotype Prediction. A) Ratio values from I179T⁄WT were plotted for all 53 samples. Using the data here along with C initial genotype classifications were made as well as preliminary grouping thresholds. B) Hierarchical clustering shows potential groupings across all 53 samples. In this case, the information that there should be three groups was provided to the algorithm as there are three possible genotypes.
