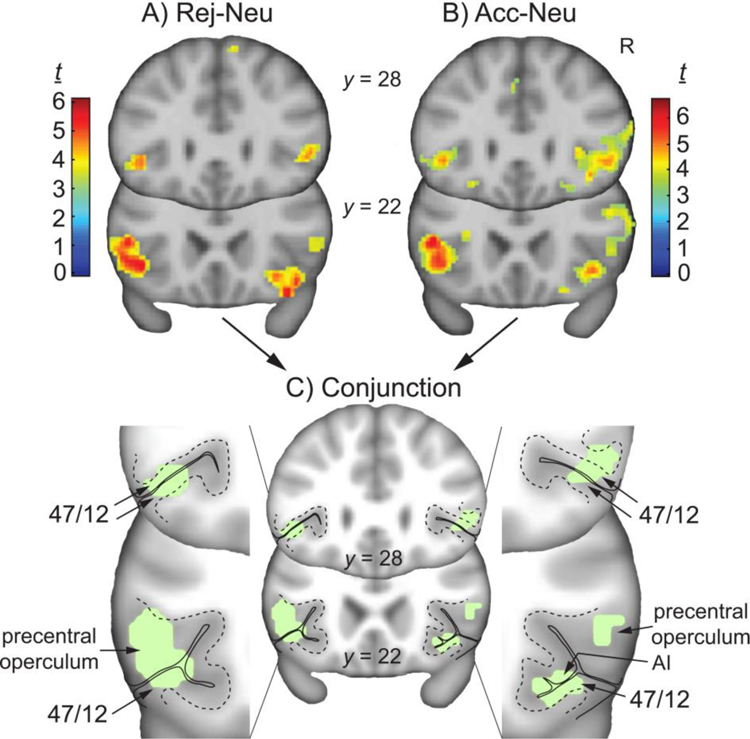
Fig. 3. Activity during rejection and acceptance, and their conjunction.
Whole-brain contrast t maps for A) Rej-Neu, B) Acc-Neu), and C) conjunction of both contrasts (green), with magnified view of the vlPFC; R, right; AI, anterior insula; y coordinates in Montreal Neurological Institute stereotactic space. Contrast t maps displayed at uncorrected P < 0.001, kE > 10.

