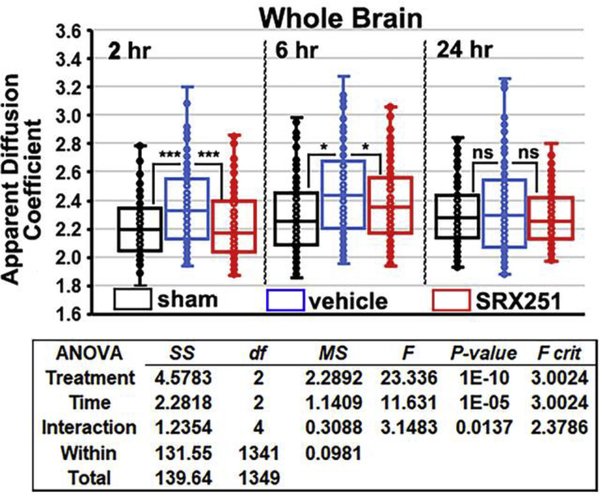
Figure 1. Edema in whole brain.
Shown are scatter plots of average ADC values taken from whole brain (150 areas) for sham (black), vehicle (blue) and SRX251 (red) treatments 2, 6 and 24 hrs post head injury. The analysis from a two-way ANOVA is shown below. ns – not significant, *** p<0.001, * p<0.05

