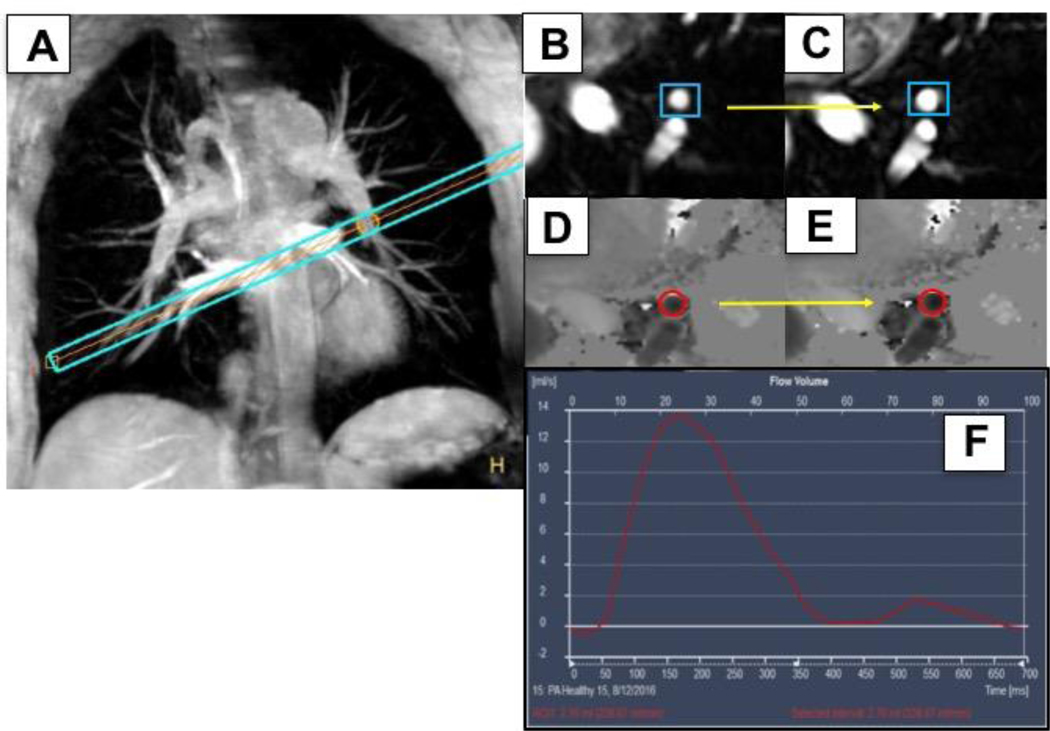
Figure 1:
Example of a healthy adult coronal image of the pulmonary arterial tree. A slice perpendicular (A, blue bars) to the descending branch of the left pulmonary artery (PA) is shown with an arrow (yellow) pointing to the center of the imaging plane in a PA segment. (B) Corresponding PA cross sectional segment at rest (blue box) and (C) during isometric handgrip exercise (IHE), showing PA dilation (yellow arrow). (D) Phase contrast images of the same PA segment (red circle) at rest and during IHE (E). (F) Illustrates the corresponding blood flow profile of a PA segment illustrating blood flow integrated over time in the cardiac cycle (in msec, x-axis).

