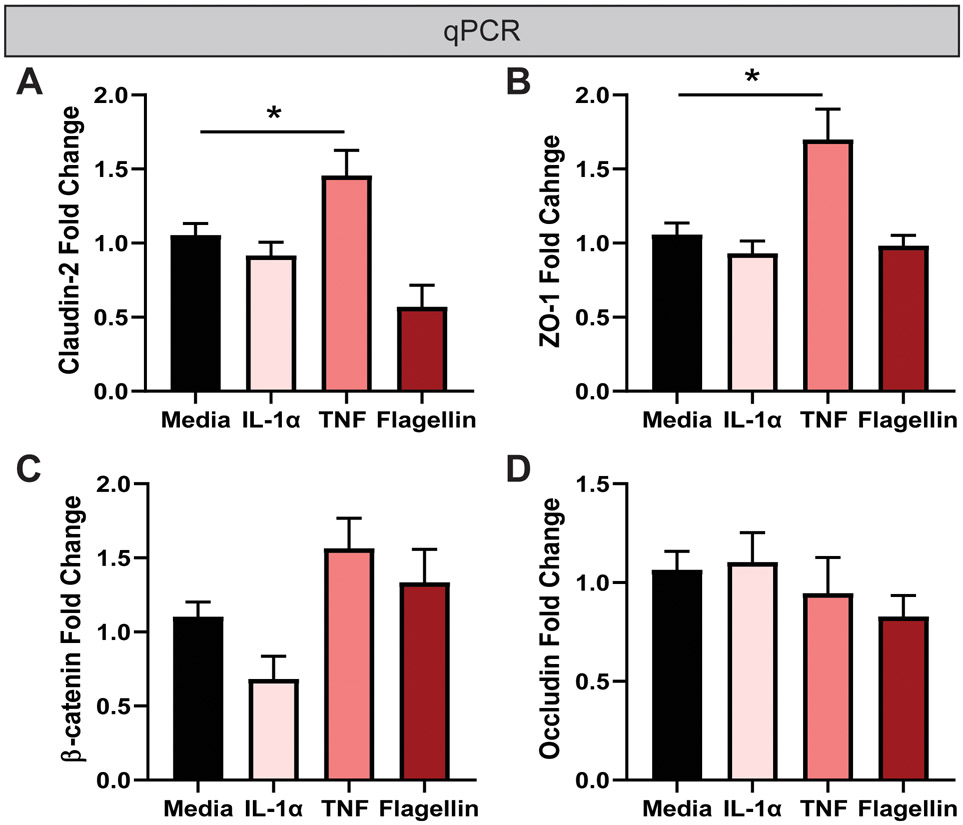
Figure 3. TNF modulates tight junction gene expression by qPCR.
Real time quantitative PCR (qPCR) was used to examine the relative expression of junction markers A. Claudin-2, B. ZO-1, C. β-catenin, and D. Occludin. HIEs were incubated for 16hours in media, 1 μg/ml IL-1α, TNF and flagellin. The cells were then collected in TRIZOL and RNA isolated. qPCR was then formed to evaluate tight junctions. Data is presented as the ΔΔCT with the house-keeping gene 18S. n=3 wells/experiments, representative of 3 independent experiments. One-Way ANOVA. *p< 0.05.

