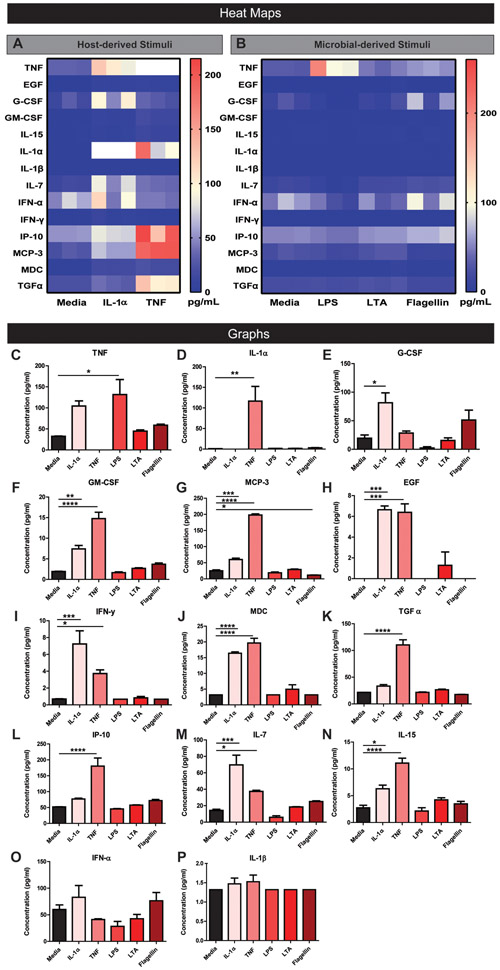
Figure 5. Representative Magpix analysis of HIE supernatants after stimulation by host and microbial factors showing mild cytokine production.
Heat map representation of low cytokine concentrations in the supernatant after enteroids were stimulated with host cytokines TNF or IL-1α (1 μg/ml)(A) or microbial stimuli LPS, LTA, or flagellin (1 μg/ml)(B) in simplified CMGF− media for 16 hrs. Representative individual Magpix results comparing the amount of cytokine production between the stimulated group and simplified CMGF− media control group for C. TNF, D. IL-1α, E. G-CSF, F. GM-CSF, G. MCP-3, H. EGF, I. IFN-γ, J. MDC, K. TGF α, L. IP-10, M. IL-7, N. IL-15, O. IFN α, and P. IL-1β. One Way ANOVA * p<0.05, ** p<0.01, *** p<0.001, **** p<0.0001. n=3 wells/experiments, representative of 3 independent experiments.

