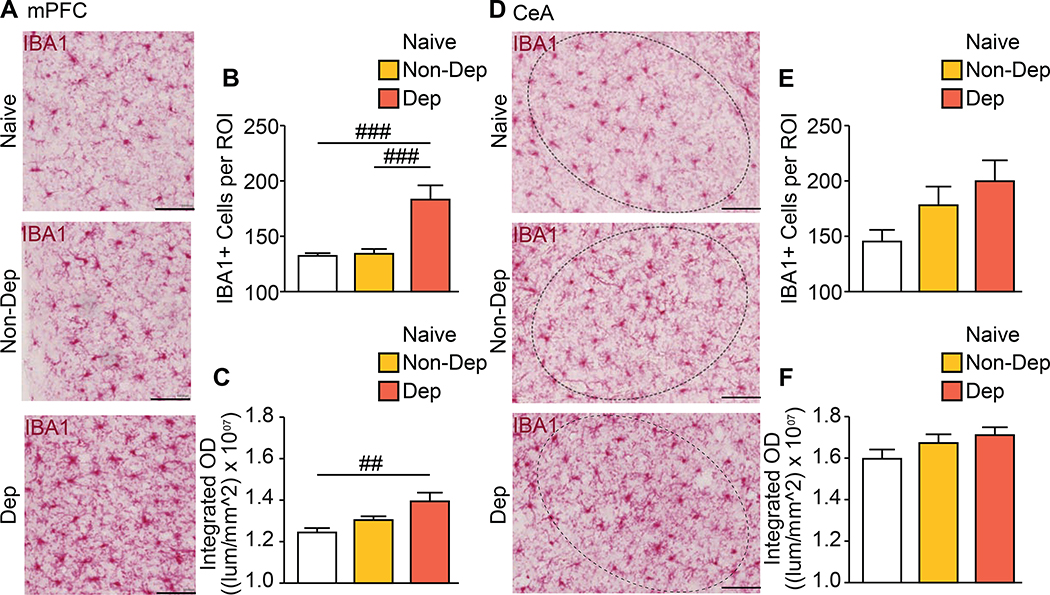
Figure 1. Increased number of MG in mPFC of dependent mice.
(a) Representative images of Ionized Calcium Binding Adaptor Molecule 1 (IBA1)-labeled (red) MG in the medial prefrontal cortex (mPFC) of Naïve, non-dependent (Non-Dep) and alcohol-dependent (Dep) mice. Summary graph of (b) the number of IBA1+ cells and (c) integrated optical density (OD) present in the mPFC. (d) Representative images of IBA1-labeled (red) MG in the central nucleus of the amygdala (CeA) of Naïve, non-dependent (Non-Dep) and dependent (Dep) mice. Circled region of interest (ROI) indicates the CeA. Summary graphs of (e) the number of IBA1+ cells and (f) integrated OD present in the CeA. Scale bar = 100 μm. Data are presented as mean±SEM values; ## P<0.01; ### P<0.001.

