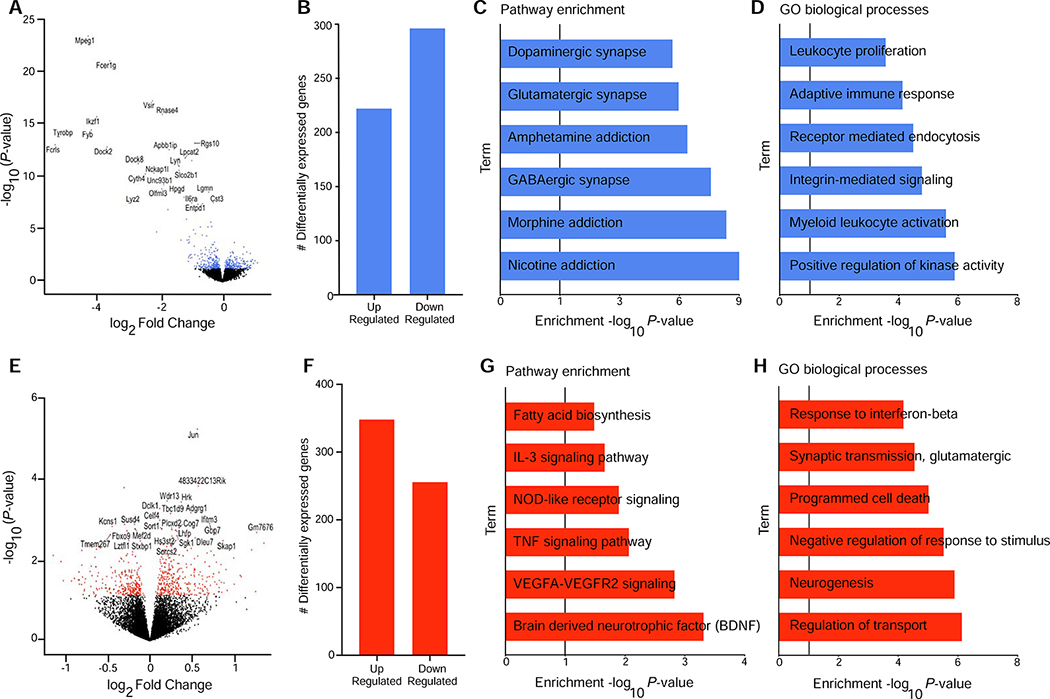
Figure 3. mPFC transcriptome is altered in response to MG depletion and alcohol dependence.
(a) Volcano plot showing log2 Fold Change against log10 P-value for the main effect of microglia (MG) Depletion. Differentially expressed genes (DEG) (P<0.05) are shown as blue dots. The top (DEG) are labeled. (b) Number of upregulated and downregulated DEG in the medial prefrontal cortex (mPFC) (P<0.05) after MG depletion. (c, d) Pathway enrichment (Webgestalt) and gene ontology (GO) biological process (Webgestalt) analyses, respectively for genes identified after MG depletion. (e) Volcano plot showing log2 Fold Change against log10 P-value for the main effect of alcohol dependence. DEG (P<0.05) are shown as red dots. The top DEG are labeled. (f) Number of upregulated and downregulated DEG in the mPFC (P<0.05) after alcohol dependence. (g, h) Pathway enrichment (Enrichr) and gene ontology (GO) biological process (Webgestalt) analyses, respectively for genes identified after alcohol dependence.

