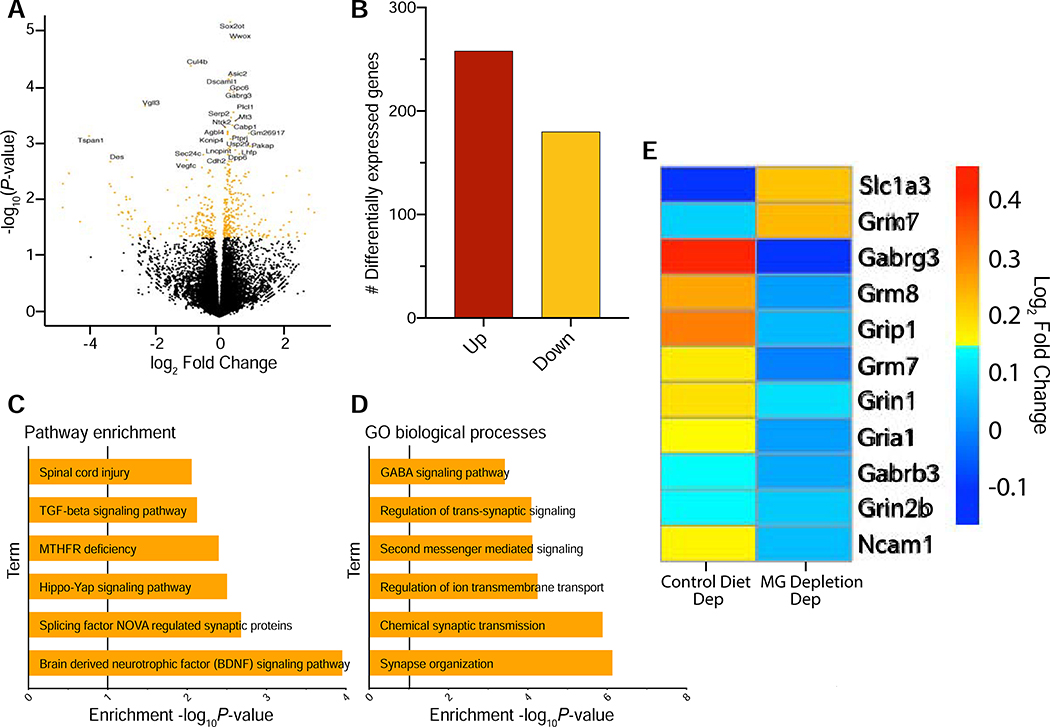
Figure 5. Differential gene expression after alcohol dependence in the CeA.
(a) Volcano plot showing log2 fold-change against log10 P-value in central nucleus of the amygdala (CeA). Differentially expressed genes (DEG) (P < 0.05) are shown as orange dots. The top DEG are labeled. (b) Number of upregulated and downregulated DEG in the CeA (P<0.05) after alcohol dependence. (c, d) Pathway enrichment and gene ontology (GO) biological process analysis for genes identified after alcohol dependence. (e) Heatmap displaying expression levels of differentially expressed glutamatergic and GABAergic genes in the CeA after alcohol dependence (Control Diet/Dep) or after alcohol dependence and microglia (MG) Depletion (MG Depletion/Dep). Color indicates expression level (regularized log transformed gene counts).

