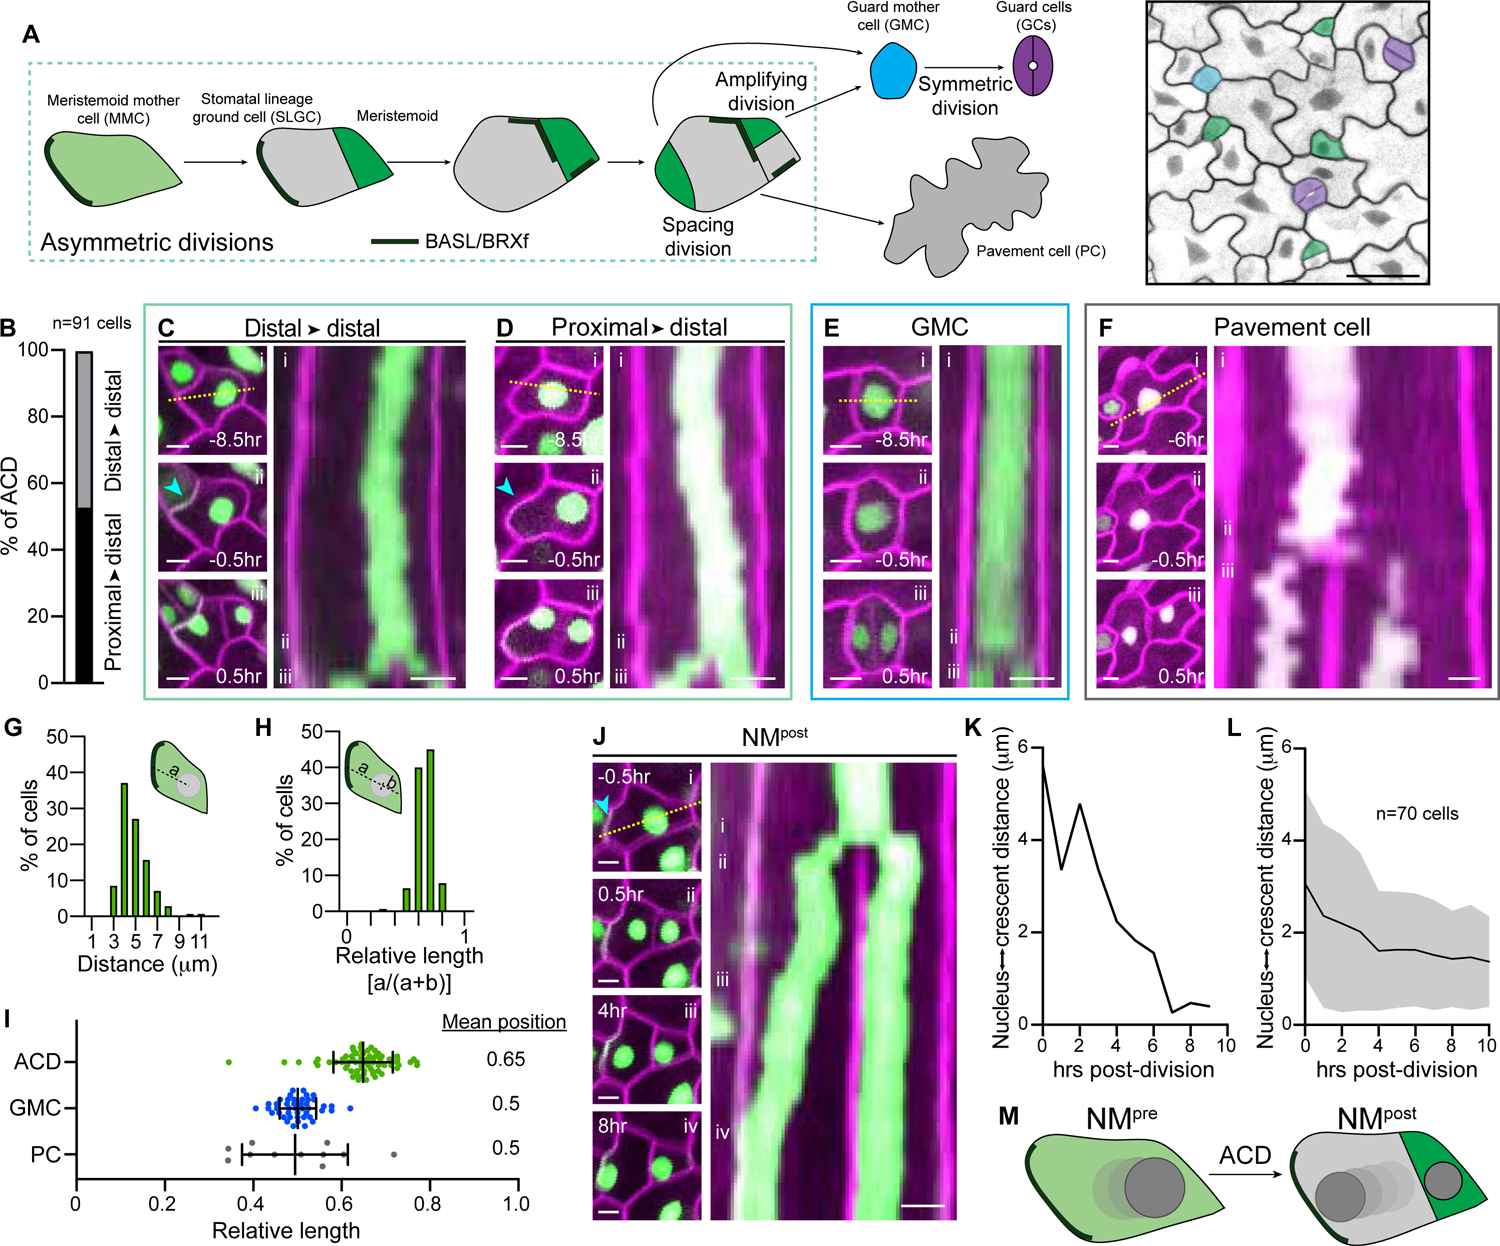
Figure 1. Successive nuclear migrations bookend ACD in the stomatal lineage.

A. Schematic of the Arabidopsis stomatal lineage divisions, cell types, and polarity crescents (left). Epidermis of a 3dpg cotyledon (right) from the R2D2 BRXL2::BRXL2-YFP ML1::mCherry-RCI2A line, pseudo-colored to indicate cell types. Scale bar-25μm.
B. Percent of asymmetrically dividing cells with nuclei initially positioned proximal or distal to polarizing BRXL2. n-91 cells.
C–D. Examples of two classes of nuclear positioning before ACD in R2D2 BRXL2::BRXL2-YFP ML1::mCherry-RCI2A cotyledons. Stills (left) illustrate asymmetrically dividing cells (i) 8.5hr before division, (ii) 0.5hr before division, and (iii) 0.5hr post-ACD. Kymograph (right) generated from the dotted line in (i). The cyan arrowhead indicates the polarity crescent. Scale bars-5μm.
E. Stills (left) and kymograph (right) showing the nuclear position during a representative GMC division (same format as in Figure 1C). Scale bars-50μm.
F. Stills (left) and kymograph (right) showing the nuclear position during a representative PC division (i) 6hr before division, (ii) 0.5hr before division, and (iii) 0.5hr post-ACD. Scale bars-5μm.
G–H. Distribution of the distances from the pre-ACD nuclear center to the polarity crescent, plotted as absolute distance from the distal wall (G) or as a relative distance along the cell axis orthogonal to the division plane (H). n-140 cells.
I. Relative nuclear positions before division in the indicated cell types. The ACD data is derived from those plotted in Figures 1G and 1H (see Methods for details). ACD-70 cells, GMC-44 cells, PC-11 cells. Data are represented as mean±standard deviation.
J. Stills (left) and kymograph (right) of NMpost in an SLGC. Stills show the cell (i) 0.5hr before ACD, (ii) 0.5hr after ACD, (iii) 4hr after ACD, and (iv) 8hr after ACD. Kymograph (right) generated from the dotted line in (i). The cyan arrowhead indicates the polarity crescent. Scale bars-5μm.
K. SLGC nucleus-to-crescent distance during NMpost, quantified from the cell shown in Figure 1J.
L. Average SLGC nucleus-to-crescent distance during NMpost. Data are represented as mean±standard deviation.
M. Schematic showing the two, oppositely oriented nuclear movements, NMpre and NMpost, that flank ACD. Nuclear color deepens in later timepoints.
