FIGURE 4.

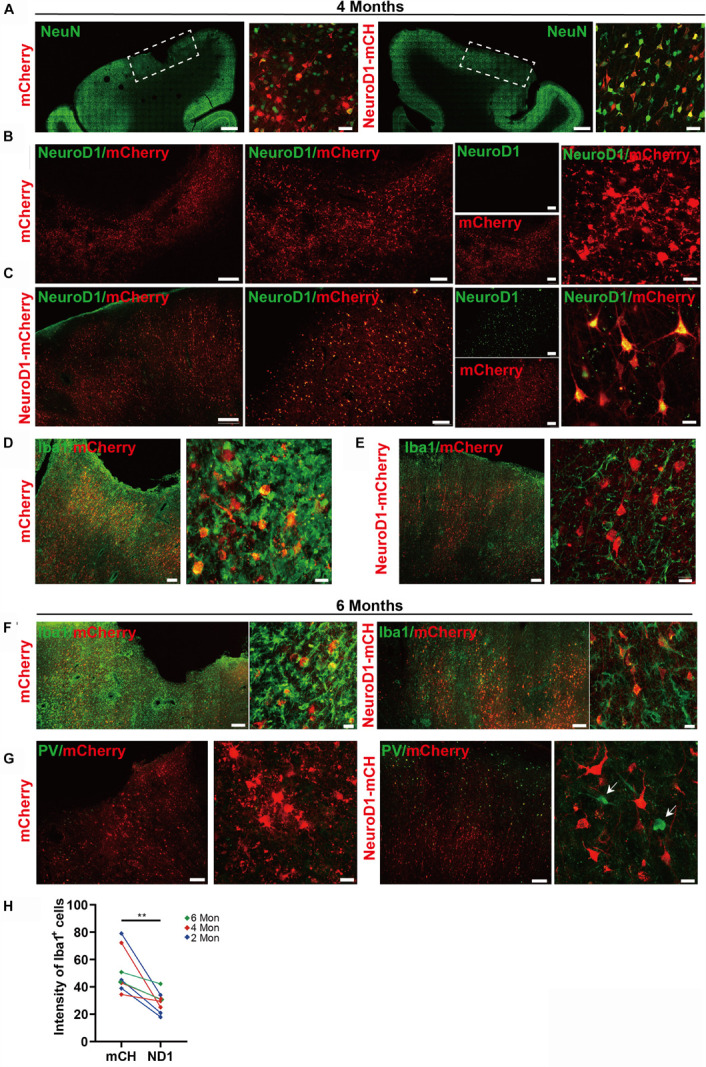
Long-term effect of NeuroD1-treatment in NHP ischemic stroke model. (A) Representative images illustrating neuronal density (NeuN, green), cortical tissue integrity, and viral infected cell morphology at 4 months post viral injection (virus injected at 21 dps, for panels A–E). Scale bars, 2000 μm for low mag, 50 μm for high mag. (B,C) Identification of NeuroD1 (green) expression at low and high magnification among viral infected cells. As expected, NeroD1 signal (green) was only detected in the NeuroD1-mCherry infected side (C), but not the control side (B). Note that the NeuroD1-mCherry infected cells displayed clear neuronal morphology. Scale bar, 500 μm (low mag, left 4 panels), 200 μm (higher mag, middle 4 panels), 20 μm (highest mag, right 2 panels). (D,E) Representative images in low and high magnifications illustrating significant reduction of microglia and macrophage (IBA1, green) in the NeuroD1-infected areas (E), compared to the control mCherry infected areas (D). Scale bar, 200 μm (low mag, middle panels), 20 μm (high mag, right panels). (F) Representative images illustrating a reduction of microglia and macrophage (IBA1, green) in NeuroD1-infected areas (right panels), compared to the control mCherry infected areas (left panels). Virus injected at 21 dps, and immunostaining performed at 6 months post viral injection (for both panel F and G). Scale bar, 200 μm (low mag), 20 μm (high mag). (G) Representative images illustrating the protection of parvalbumin (PV) interneurons (green, arrow) in and surrounding the NeuroD1-infected areas (right panels), compared to the control mCherry-infected areas (left panels). Scale bar, 200 μm (low mag), 20 μm (high mag). (H) Quantitation of the Iba1 intensity in the NeuroD1 side compared to the control side among the 8 monkeys injected with virus at 21 days following ischemic injury. **p = 0.0078 by Wilcoxon matched-pairs signed rank test.
