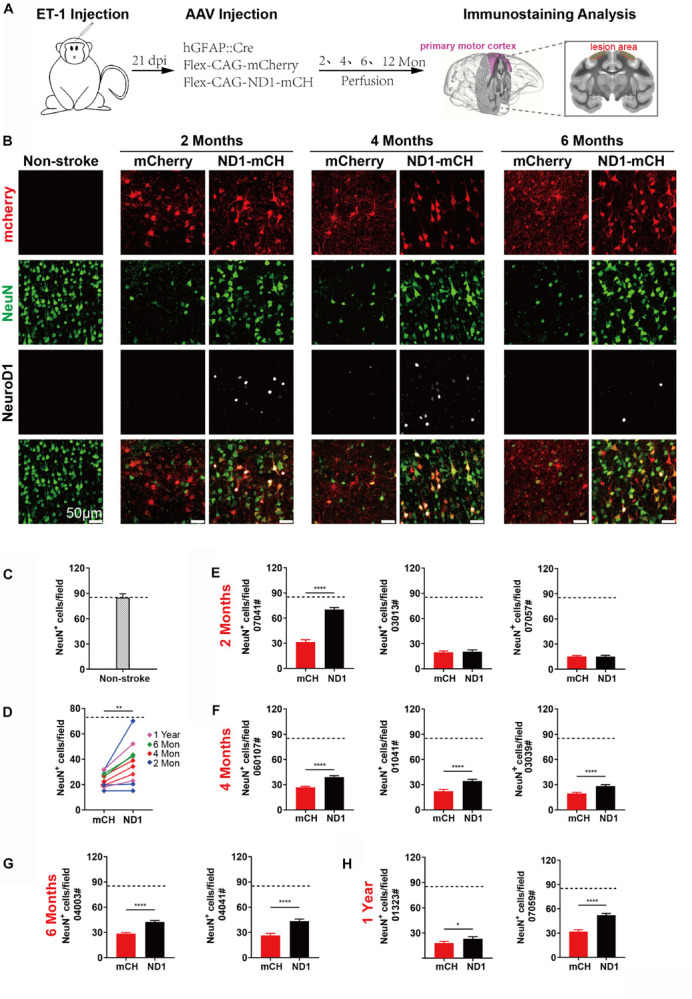
FIGURE 5.

Increased neuronal density after NeuroD1-treatment. (A) Schematic illustration of our experimental design. (B) Representative images showing triple immunostaining of mCherry (red), NeuN (green) and NeuroD1 (white) in non-stroke cortex (left column) and the stroke cortex followed with viral injection (right 6 columns). NeuroD1-infected areas showed a consistent increase in the number of NeuN+ neurons (green) compared to the control side at 2, 4, and 6 months post viral infection. Note that NeuroD1 signal showed a significant decrease at 6 months compared to that at 2- and 4-months post viral infection. Scar bars, 50 μm. (C) Quantified data showing the mean number of NeuN+ cells in the motor cortex of non-stroke monkey. Data are represented as mean ± SEM. N = 30 random fields from triplicate slices. Each field = 0.1 mm2. (D) Quantitation of the neuronal density in the NeuroD1 side compared to the control side among the 10 monkeys injected with virus at 21 days following ischemic injury. **p = 0.0039 by Wilcoxon matched-pairs signed rank test. (E–H) Non-biased quantitative analyses on the neuronal density in the NeuroD1-treated versus control mCherry-treated cortex in each individual of the 10 monkeys. Viral infection was conducted at 21 days after ischemic injury, and immunostaining was performed at 2, 4, 6 months and 1-year post viral injection. Data are represented as mean ± SEM (n = 30–40 images per section, 6–8 sections per animal, total 180–240 fields/animal; Each field = 0.1 mm2). *p = 0.020, ****p < 0.0001 by Mann–Whitney test.
