FIGURE 6.

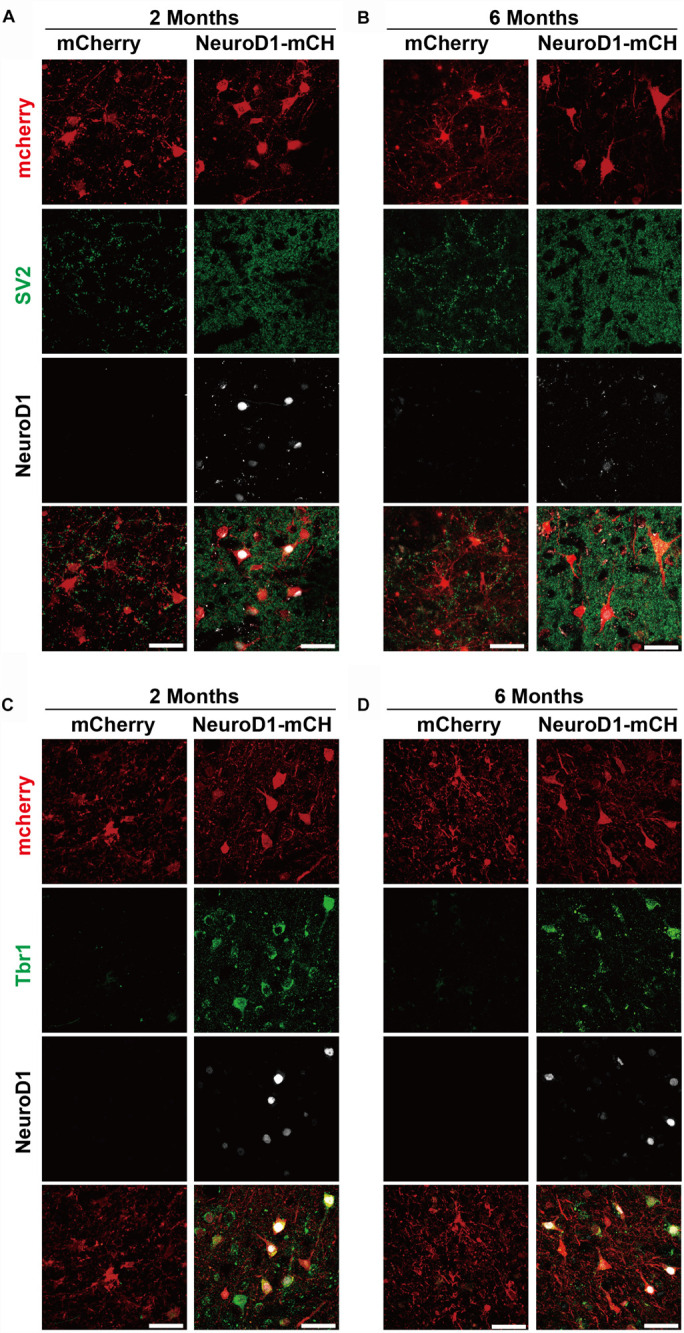
Cortical neuron identity for astrocyte-converted neurons in monkey cortex. (A–B) Representative images showing triple immunostaining of mCherry (red), SV2 (green) and NeuroD1 (white) in the NeuroD1-mCherry or mCherry-infected areas at 2- or 6-months post viral injection (21 days after stroke). Data shows significantly increased synaptic puncta (SV2) in the NeuroD1-infected areas, compared to the control mCherry-infected areas. Note a significant decrease of NeuroD1 expression at 6 months following viral infection. Scale bars, 50 μm. (C,D) Representative images showing triple immunostaining of mCherry (red), Tbr1 (green) and NeuroD1 (white) in the NeuroD1-mCherry or mCherry-infected areas at 2- or 6-months post viral injection (21 days after stroke). Most of the NeuroD1-expressing neurons were Tbr1+. Scar bars, 50 μm.
