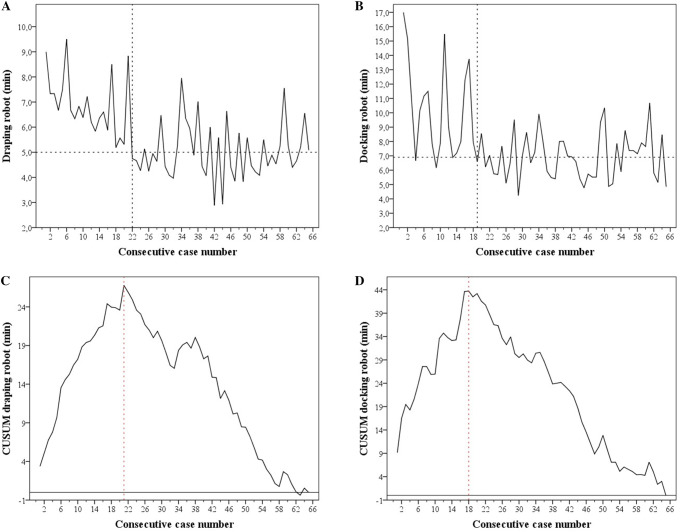
Fig. 2.
Institutional robot draping and docking times and CUSUM plots. a, b Represent draping and docking times versus consecutive case number. The vertical dashed lines indicate the first case after completion of the learning phase of the associated step. The dashed horizontal lines indicate the mean time after completion of the learning phase of the associated step. c, d Represent the plots of CUSUM versus consecutive case number. The vertical dashed lines indicate the inflection point of the CUSUM curves

