Fig. 3.
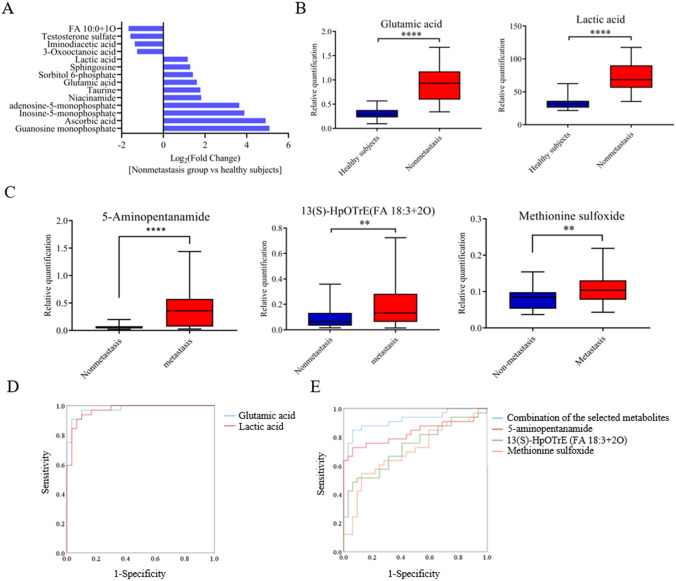
Determination of potential biomarkers for diagnosis and monitoring. A total of 14 metabolites with AUC values greater than 0.9. B Variations of glutamic acid and lactic acid between the nonmetastatic group and healthy controls. ****p < 0.0001. C Variations of 5-aminopentanamide, 13(S)-HpOTrE (FA 18:3 + 2O), and methionine sulfoxide between the metastatic group and the nonmetastatic group. **p < 0.0001, ****p < 0.0001. D ROC curves of glutamic acid and lactic acid providing an auxiliary diagnostic ability for osteosarcoma. AUCglutamic acid = 0.98; AUClactic acid = 0.97. E ROC curves of the combination of the selected metabolites, 5-aminopentanamide, 13(S)-HpOTrE(FA 18:3 + 2O), and methionine sulfoxide providing monitoring ability for tumor metastasis. AUCcombination of the selected metabolites = 0.92, AUC5-aminopentanamide = 0.83, AUC13(S)−HpOTrE (FA 18:3+2O) = 0.73, AUCmethionine sulfoxide = 0.70

