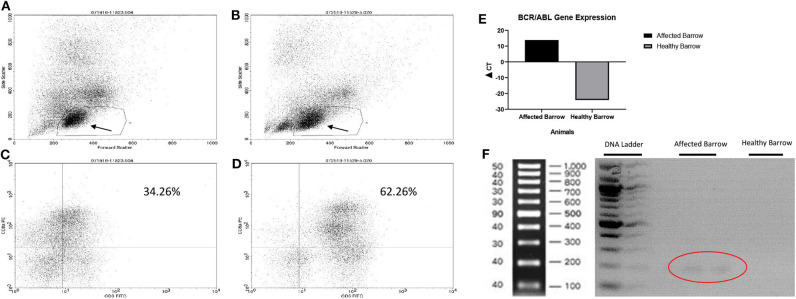
Figure 3.
Flow cytometry plots demonstrating reduced CD3+/CD8+ cells in the barrow with leukemia (A,C) compared to an unaffected barrow (B,D). Arrows demonstrate the lymphocyte region which may also contain degranulated basophils. Expression of the BCR/ABL fusion gene in Yucatan barrows with (affected barrow) and without (heathy barrow) chronic myelogenous leukemia (E). Gel image demonstrating the BCR/ABL gene in the affected barrow (circle) (F).

