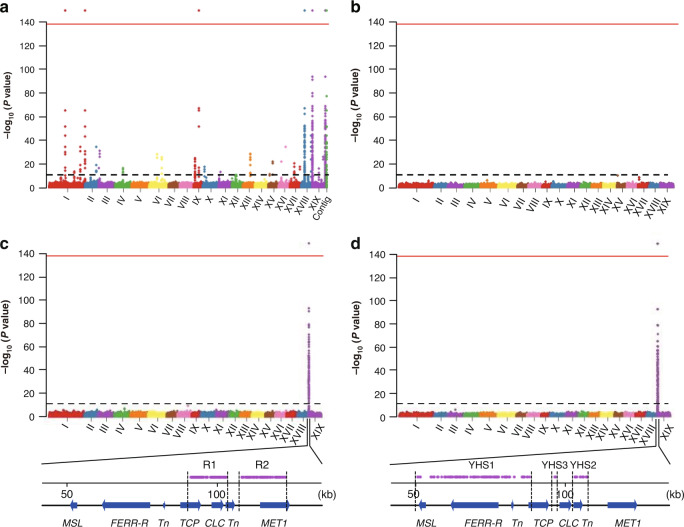
Fig. 2. Manhattan plots of GWAS analysis of P. deltoides sex phenotypes.
The y-axis shows the negative logarithm of P values from Wald Chi-Squared Test implemented in GEMMA. The black dashed line above the x-axis indicate the cut-off P value = 1e-9 (corresponding Bonferroni significance = 0.01). The red line at the top of each diagram indicate cut-off P value = 1e-137 (corresponding to Bonferroni significance = 1e-130). The Roman numerals under the x-axis indicate the chromosome identity. a shows results of SNPs GWAS using the female genome as the reference (‘Contig’ on the x-axis represents the unplaced Contig01665). b shows results of coverage GWAS using the female genome as the reference. c shows results of SNPs GWAS using SLR-Y as reference. d shows results of coverage GWAS using SLR-Y as reference. R1, R2, YHS1-YHS3 at the bottom of c and d indicate regions contain GWAS signals completely associated with sexes. Note that the FERR-R and MSL genes are not shown as significant in c, because the SNP analysis is not relevant to these genes, since they are absent from the X haplotype.

