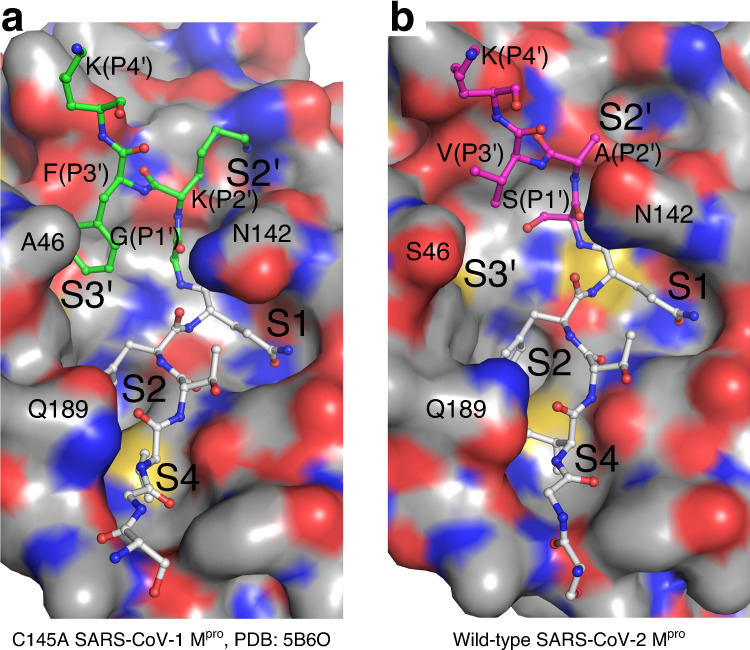
Fig. 4. Modeling of the SARS-CoV-2 Mpro enzyme–substrate complex.

a CPK molecular surface of SARS-CoV-1 C145A catalytic mutant ES complex (PDB 5B60), including C-terminal cleavage site P6–P4′ (P1′–P3′ with green carbons). b CPK molecular surface for the SARS-CoV-2 Mpro acyl-enzyme active site. The additional residues P1′–P4′ (magenta carbons) are modeled based on (a). Sequence alignment for all Mpro processing sites shown in Supplementary Fig. 1b. Note the identical sequence preceding the scissile bond between SARS-CoV-1 and -2 Mpro, but divergence in P1′–P3′ (N-terminus of the subsequent nsp6). Despite these differences, the S1′–S3′ pockets observed in the SARS-CoV-2 Mpro acyl-enzyme active site are similar to that in (a), i.e., already preformed in the absence of P1′–P3′ (modeled here), and apparently not dependent on the binding of P2′. It is also evident from this panel that the P1′–P3′ side chains are not sterically matched to the S1′–S3′ pockets, perhaps an advantage in protein maturation.
