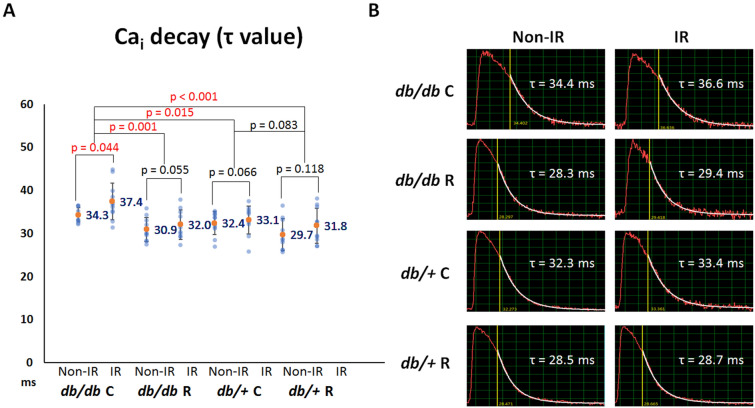
Figure 3.
Effects of ranolazine therapy on intracellular Ca2+ (Cai) decay. (A) Scattered graphs of Cai decay tau values among the four groups and between the ischemia–reperfusion (IR) and non-IR zones. Orange dots and numbers indicate the mean values. Ranolazine therapy shortened the tau value in db/db mice and ameliorated the differences of tau values between the non-IR and IR zones in db/db mice. (B) Representative examples of Cai decay in the non-IR and IR zones among the four groups.

