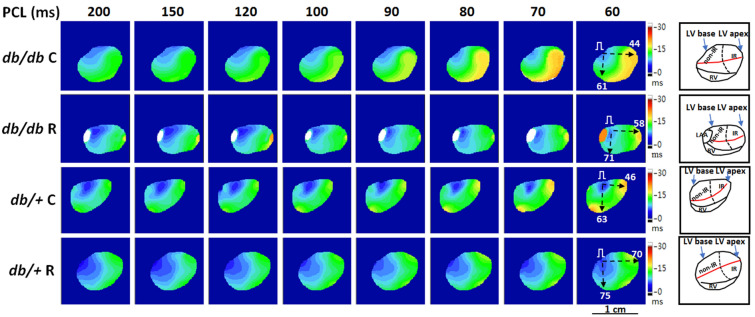
Figure 4.
Representative examples of isochrone maps at a pacing cycle length (PCL) from 200 to 60 ms in four groups. Black dashed arrows indicate the directions of CVnon-IR (conduction velocity (CV) along the atrioventricular ring) and CVIR (CV pointing to the apical ischemia–reperfusion zone) measurements; numbers in right subpanels are CV (cm/s). Right subpanels show the anatomical structure and orientation of optical maps. Ranolazine therapy ameliorated CVIR slowing to ameliorate conduction inhomogeneity (see Table 1). Red line, left coronary artery; dashed line, margin of IR zone; LAA, left atrial appendage; LV, left ventricle; RV, right ventricle.

