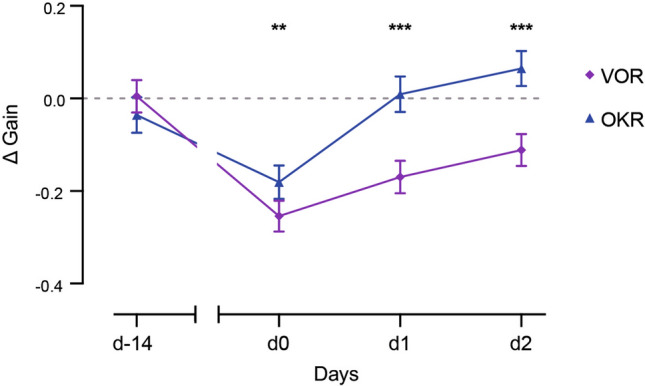
Figure 4.

Comparison of the amplitude and dynamics of VOR and OKR gain changes over time. Global gain changes in VOR (purple diamonds) and OKR (blue triangles) over time were compared by subtracting the mean responses of the Sham group from those of the VVM-exposed mice (ΔGain). Differences between VOR and OKR responses of both VVM-exposed groups are represented with black asterisks. Error bars represent ± SEM; Newman Keuls post-hoc test *p < 0.05; **p < 0.01; ***p < 10–3.
