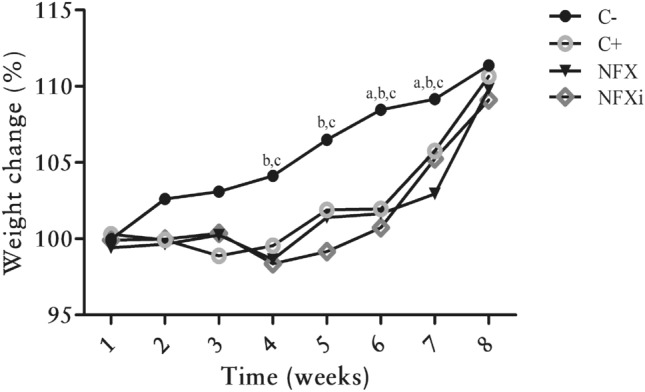
Figure 2.

Percentage of the initial body weight of BALB/c mice with or without TNBS administration as a function of time. a Experimental group whose body weight percentages were significantly different from those of the C+ group. b Experimental group whose body weight percentages were significantly different from those of the NFX group. c Experimental group whose body weight percentages were significantly different from those of the NFXi group. The data are shown as the means ± SDs from three independent experiments (n = 18). p value: *p < 0.05.
