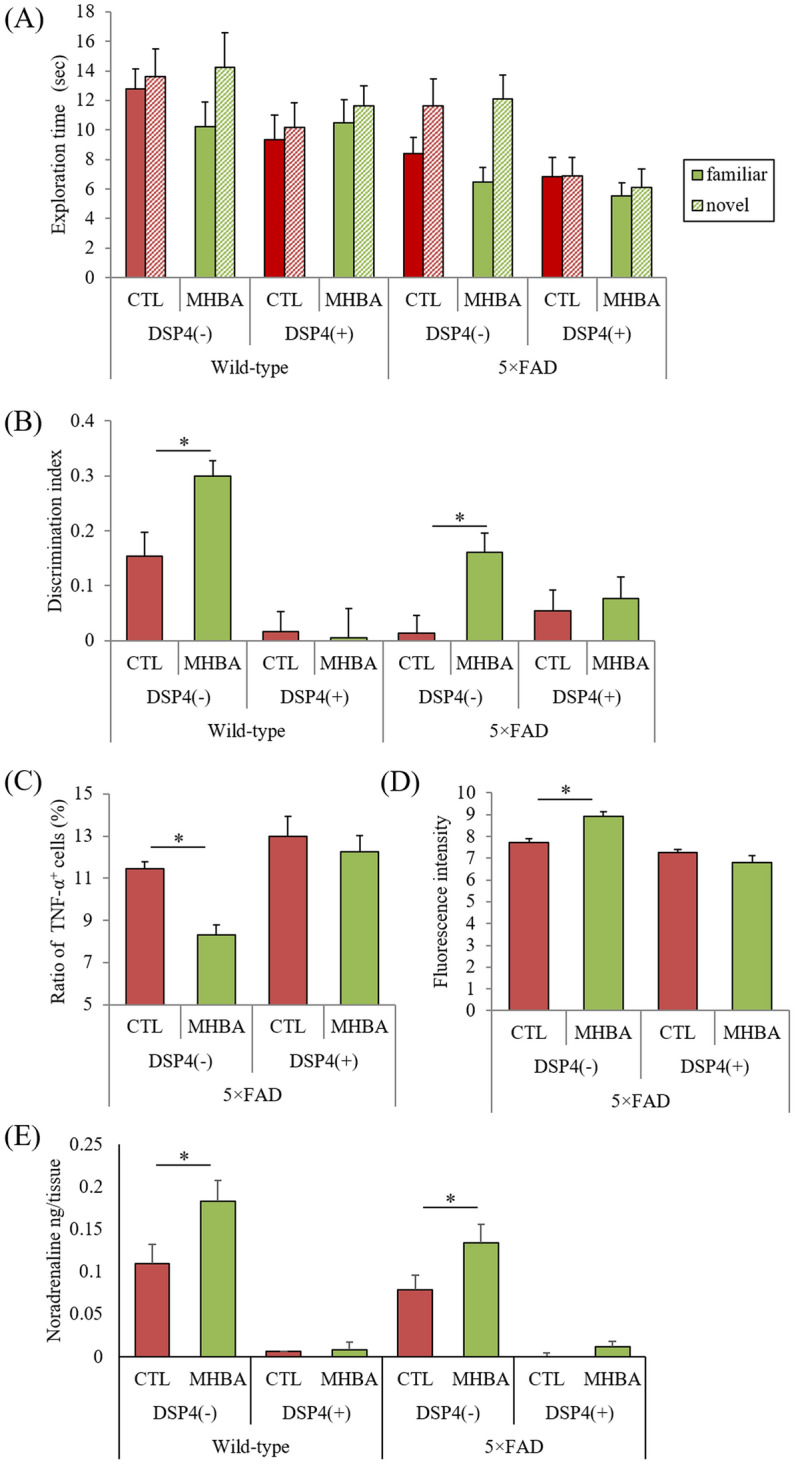
Figure 5.

Effects of MHBAs on microglial activation in 5 × FAD mice. Transgenic 5 × FAD and wild-type male mice aged 2.5 months were fed a diet with or without 0.05% w/w MHBAs for 3.5 months. Mice were treated intraperitoneally with saline or 50 mg/kg DSP-4 at 2.5, 2.7, 3.5, 4.5, and 5.5-months of age. (A) Time of exploring novel or familiar objects. (B) Discrimination index in the novel object recognition test. (C) and (D) Isolated microglia were treated with a leukocyte activation cocktail and analyzed using flow cytometry to measure intracellular cytokines. Isolated microglia were incubated with 500 nM FAM-labeled Aβ, and the fluorescence intensity of the entire area of 5 wells/sample was measured at 485-nm excitation/535-nm emission. The graph in C shows the percentage of TNF-α-producing cells among CD11b-positive cells. The graph in D shows the fluorescent intensity of Aβ-FAM-treated microglia. E, Noradrenaline levels in the brainstem measured using a high-performance liquid chromatography-electrochemical detection system. Data are mean ± standard error (10 mice per group). The p values shown were calculated by Two-way ANOVA and Tukey–Kramer as a post-hoc test *p < 0.05. MHBAs, matured hop bitter acids; DSP-4, N-(2-chloroethyl)-N-ethyl-2-bromobenzylamine; TNF-α, tumor necrosis factor-α; Aβ, amyloid-beta; CTL, control.
