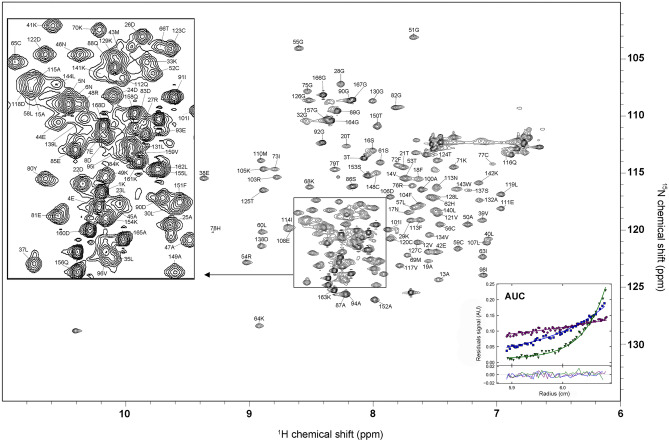
Figure 1.
2D 1H–15N HSQC spectrum of GLuc. The peak assignments are shown using the one-letter code followed by the residue number. Resonance assignments are numbered starting at the first residue (lysine) behind the secretion tag, which was removed without affecting the bioluminescence activity. Mutations at E100A and G103R do not affect activity and are described in our prior paper13. The inset in the right bottom (marked AUC) shows the result of sedimentation equilibrium experiments of GLuc protein (concentration at 0.3 mg/mL). Scans from three different rotor speeds (●: 12,000 rpm; ■: 22,000 rpm; ▼: 37,000 rpm) monitored at 280 nm. The lines represent the fit to a single species model. The determined molecular weight was 22 kDa, corresponding to a monomer.

