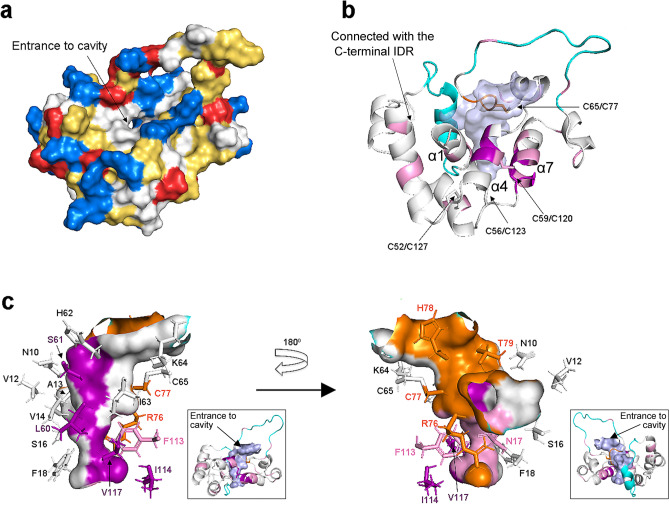
Figure 4.
The cavity shown using the representative structure (residues 10–148). The structures were generated using PyMOL. (a) Surface representation of GLuc: positive residues (Arg, Lys and His) are colored in blue; negative residues (Glu and Asp) are colored in red; and hydrophobic residues are colored in yellow. The entrance to cavity is indicated by an arrow. (b) The cavity representation (colored in transparent light blue) of GLuc shown from the same direction as in (a). Residues that retained 1H–15N HSQC signals after 20 min and 18 h H/D exchanging are shown in pink and purple, respectively; residues located in the activity-related loop R76-T79 are in orange; two IDRs are shown in cyan. (c) Residue composition around the interior cavity. The cavity wall and its contributing residues are colored using the same color code as in (b). The insets show ribbon models of GLuc with the cavity colored in light blue and viewed from the same direction as in the main panel. The entrance to the cavity is indicated by an arrow. All structures were generated using PyMOL.

