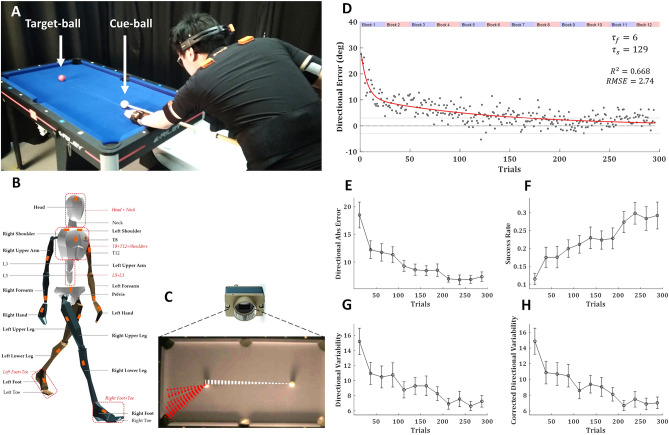
Figure 1.
Experimental setup and task performance. (A) 30 right-handed healthy subjects performed 300 repeated trials of billiards shoots of the target (red) ball towards the far-left corner. (B) Full body movement was recorded with a ‘suit’ of 17 wireless IMUs (Xsens MVN Awinda). (C) The pool balls were tracked with a high-speed camera. Dashed lines show the trajectories of the cue (white) and target (red) balls over 50 trials of an example subject. (D) The trial-by-trial directional error of the target-ball (relative to the direction from its origin to the centre of the target pocket), averaged across all subjects, with a double-exponential fit (red curve). The time constant of the fast and slow components were 6 and 129 trials, respectively. Grey lines mark the range of successful trials (less than 3 degrees form the centre of the pocket). (E) The mean absolute directional error of the target-ball. (F) The success rates. (G) Directional variability and (H) directional variability corrected for learning (see text). (E–H) presented over blocks of 25 trials, averaged across all subjects, error bars represent SEM.

