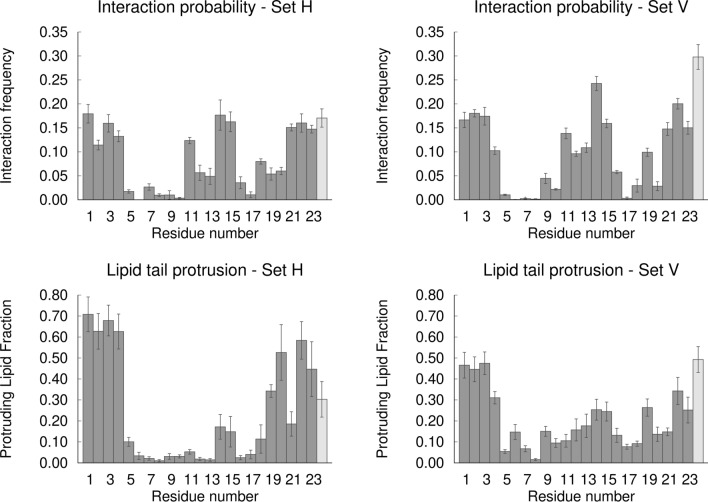
Figure 12.
Interaction with DMPC oxygen atoms (top row) and lipid tail protrusion (bottom row) per peptide residue, for the set H (left column) and set V (right column) simulations at pH 5. The plots in the top row show the frequency of interaction of each residue with the lipid phosphate and ester oxygens. A minimum distance below or equal to 0.4 nm between a given residue and a lipid oxygen is used as interaction criteria and the interaction frequency was calculated by dividing the number of frames in which the residue is interacting with a lipid by the total number of frames. The plots in the bottom row show the fraction of lipids that are interacting with a given residue among the lipids that undergo lipid tail protrusion. A lipid is considered to be protruding if any of its tail carbons extend at least 0.1 nm in the z direction beyond the phosphate group. The protruding lipid fraction for each residue was calculated by dividing the number of protruding lipids that are interacting with that residue by the total number of protruding lipids in each replicate. The interaction and protrusion values correspond to the average obtained across all replicates and the error bars were calculated using a bootstrap method: for each residue, five new values were resampled with replacement from the original set of five replicates and their mean value was computed, this process was repeated 1000 times and the error was calculated as the standard deviation of these 1000 mean values. The C-terminal residue Ser24 is displayed in light grey to highlight the fact that this residue corresponds to a flanking residue and is not part of the fusion peptide itself.

