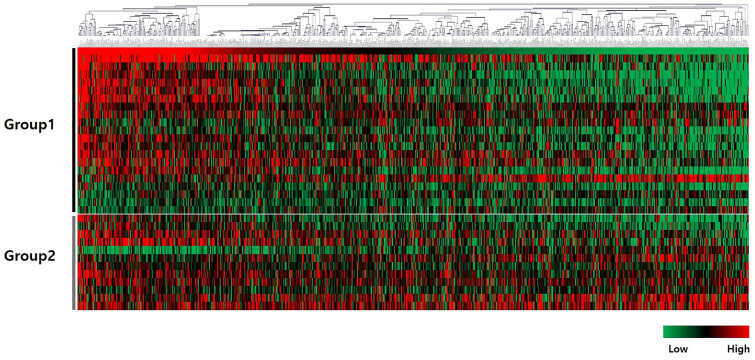
Figure 2.
Heatmaps of mRNA expression of 730 immune-related genes in 66 tumor samples from 33 patients. Patients were divided into two groups of patients: those with CD8 R/I < 1 (group1) and those with CD8 R/I > 1 (group2). A heatmap was made using the R/I ratio of each gene. Y-axis was clustered into two groups (groups 1 and 2), and x-axis was clustered hierarchically. A part of the heatmap showed a noticeable pattern between groups 1 and 2.

