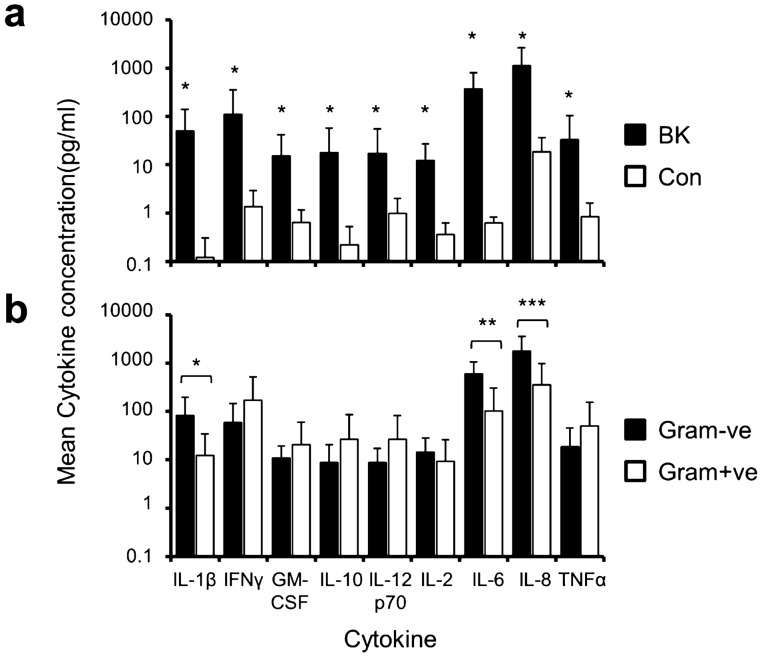
Figure 3.
Quantification of the cytokine and chemokine levels present in tears. Comparison of cytokine and chemokines levels (pg/ml) present in tears between bacterial keratitis (BK) and control (a) and Gram−ve versus Gram+ve bacterial keratitis (b) at presentation are shown in the plots. All cytokines/chemokines were elevated at presentation of bacterial keratitis compared to controls, except for IL-12p70. The levels of IL-1β, IL-6 and IL-8 were significantly greater in Gram−ve than Gram+ve bacterial keratitis. Asterisks over the bars denote statistical significance (p < 0.05).

