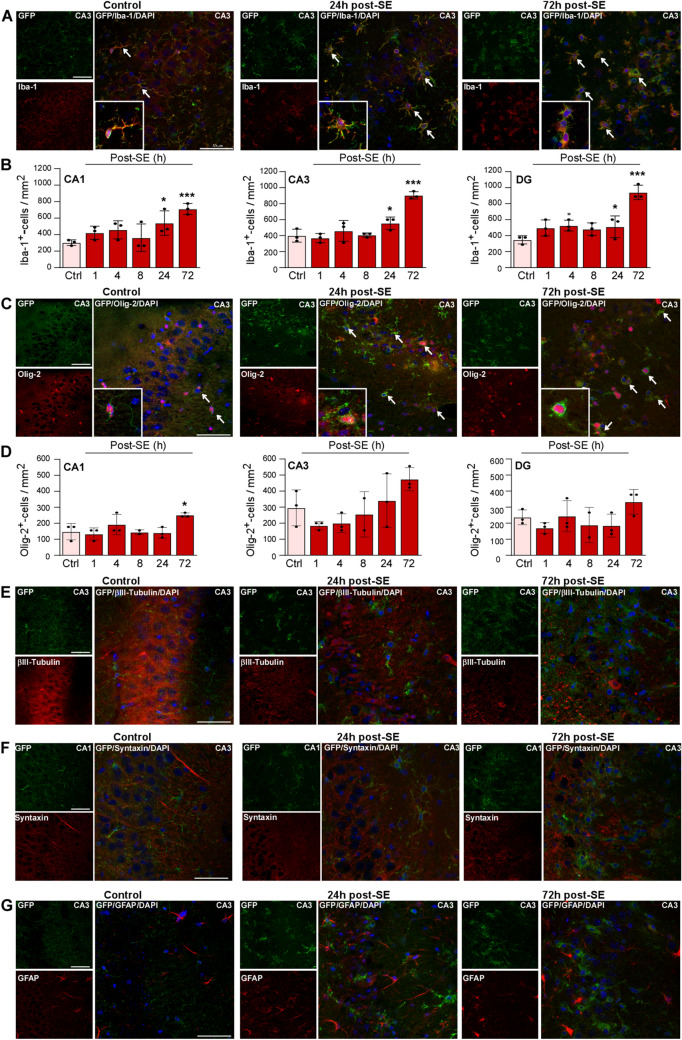
Fig. 2.
Co-localization of P2X7-EGFP with microglia and oligodendrocytes post-status epilepticus. A Representative photomicrographs (40 × magnification) showing co-localization of GFP (green) with the microglial marker Iba-1 (red) in controls and mice subjected to SE in the CA3 subfield (note that microglia showing long processes in vehicle-injected controls change to an amoeboid appearance at 24 h and 72 h post-SE) (scale bar, 50 µm). B Histograms showing more Iba-1- and GFP-positive cells post-SE in all three hippocampal subfields (CA1 Ctrl vs 24 h, 303.7 ± 19.60 vs 540.7 ± 85.43, P = 0.0224, Ctrl vs 72 h, 303.7 ± 19.60 vs 711.1 ± 38.49, P = 0.0007; CA3 Ctrl vs 24 h, 400.0 ± 46.26 vs 555.6 ± 44, P = 0.0286, Ctrl vs 72 h, 400.0 ± 46.26 vs 903.7 ± 26.71, P < 0.0001; DG Ctrl vs 4 h, 348.1 ± 29.63 vs 525.9 ± 39.20, P = 0.034, Ctrl vs 24 h, 348.1 ± 29.63 vs 511.1 ± 78.04, P = 0.0488, Ctrl vs 72 h, 348.1 ± 29.63 vs 940.7 ± 51.85, P < 0.0001; n = 3 per group). C Representative images (40 × magnification) showing co-localization of GFP (green) with the oligodendrocyte marker Olig-2 (red) in controls and mice subjected to SE in the CA3 subfield (note that oligodendrocytes, similar to microglia, show long processes in vehicle-injected controls which change to an amoeboid appearance at 24 h and 72 h post-SE) (scale bar, 50 µm). D Histograms showing more Olig-2- and GFP-positive cells post-SE in CA1 (Ctrl vs 72 h, 148 ± 29.63 vs 251.9 ± 7.407, P = 0.0115; n = 3 per group). There are no significant differences between treatment groups for the subfields CA3 and DG (n = 3 per group). E No co-localization between the neuronal marker βIII-tubulin (red) and GFP (green) under control conditions and post-SE (scale bar, 50 µm). F No co-localization of the synaptic marker syntaxin (red) and GFP (green) under control conditions and post-SE (scale bar, 50 µm). G No co-localization between the astrocyte marker GFAP (red) and GFP (green) under control conditions and post-SE (scale bar, 50 µm). *P < 0.05, ***P < 0.001.

