Fig. 3.
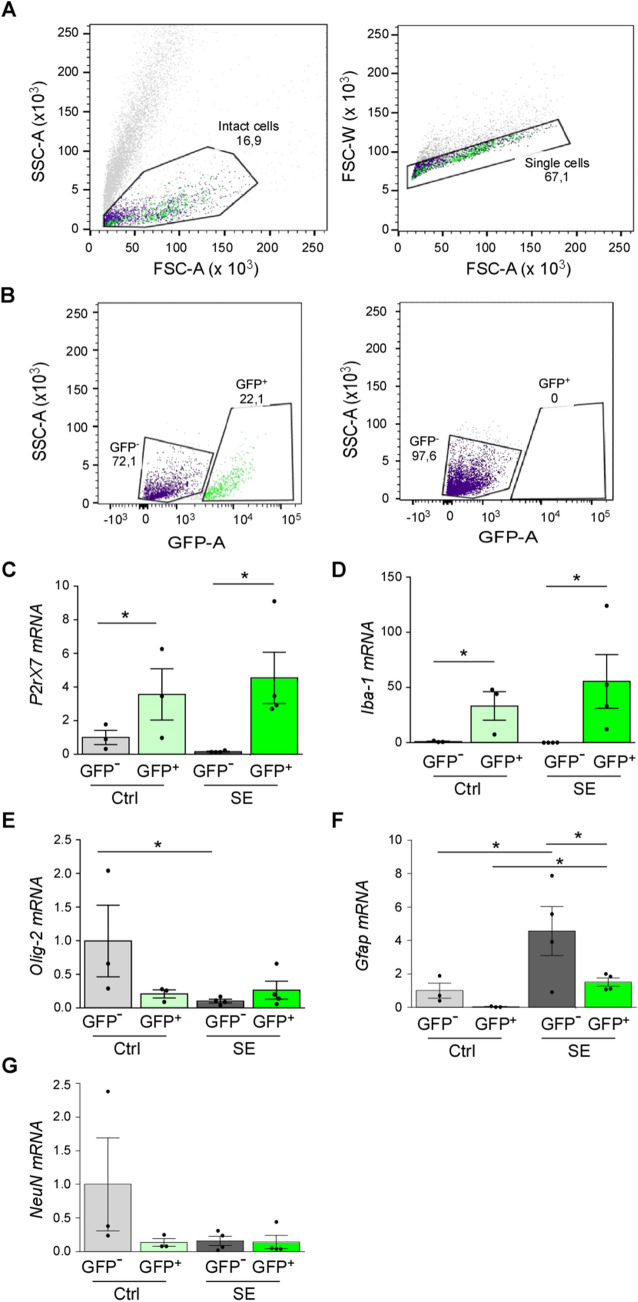
Fluorescence activated cell sorting in P2X7-EGFP mice. A The forward scatter (FSC) vs the side scatter (SSC) gate was used to exclude dead cells and the FSC-A (area) vs the FSC-H (height) gate was used to identify single cells. B The GFP-A (area) vs the SSC-A (area) gate was used to discriminate GFP-positive from GFP-negative cells. Hippocampal tissue from wild-type mice was used as a negative control to set up the gate. C–G Histograms showing mRNA levels for (C) P2rx7 (Control: GFP–, 1.000 ± 0.4244 vs post-SE, GFP+, 4.548 ± 1.526, P = 0.049; post-SE: GFP–, 0.1575 ± 0.02780, GFP+, 4.548 ± 1.526, P = 0.01), (D) Iba-1 (Control: GFP–, 0.9967 ± 0.3919 vs post-SE: GFP+, 55.51 ± 24.30, P = 0.03; post-SE: GFP–, 0.1100 ± 0.01080, GFP+, 55.51 ± 24.30, P = 0.02), (E) Olig-2 (Control: GFP–, 0.9967 ± 0.5325 vs post-SE: GFP–, 0.1025 ± 0.02689, P = 0.02), (F) Gfap (Control: GFP–, 1.000 ± 0.4539 vs post-SE: GFP–, 4.573 ± 1.466, P = 0.02; Control: GFP+, 0.03667 ± 0.01667 vs post-SE: GFP–, 4.573 ± 1.466, P = 0.005; post-SE: GFP+, 1.510 ± 0.2416 vs GFP, 4.573 ± 1.466, P = 0.03), and (G) NeuN in GFP– and GFP+ FACS-separated cells from vehicle-injected controls (Ctrl) and mice 24 h post-SE (n = 3 (Control) and 4 (SE). *P < 0.05, **P < 0.01, ***P < 0.001.

