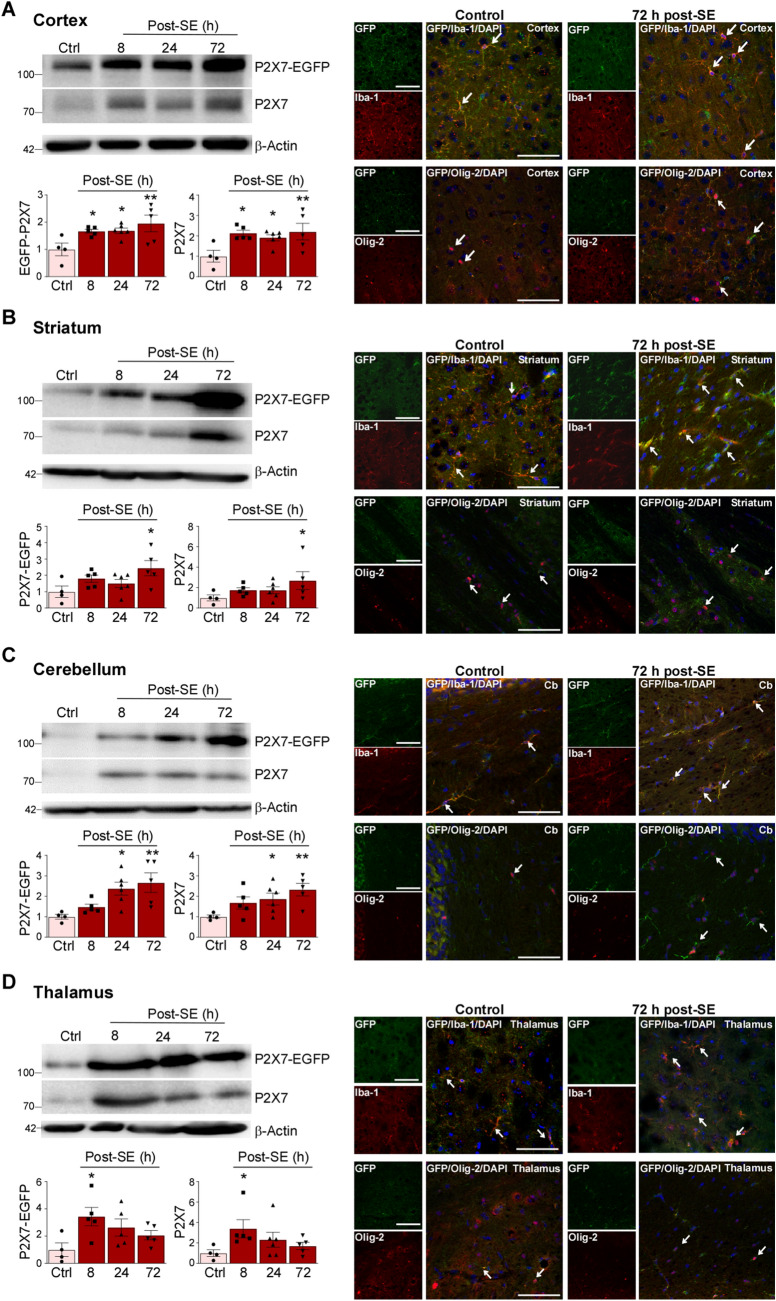
Fig. 4.
Increased P2X7 expression in extra-hippocampal areas. A–D Representative Western blots (n = 1 per lane) and histograms showing increased P2X7 expression (endogenous and P2X7-EGFP) post-SE [P2X7-EGFP, cx: Ctrl vs 8 h, 1.000 ± 0.2322 vs 1.667 ± 0.07172, P = 0.03, Ctrl vs 24 h, 1.000 ± 0.2322 vs 1.684 ± 0.09757, P = 0.03, Ctrl vs 72 h, 1.000 ± 0.2322 vs 1.953 ± 0.3028, P = 0.004; ST Ctrl vs 72 h, 1.000 ± 0.3470 vs 2.438 ± 0.4644, P = 0.01; TH Ctrl vs 8 h, 1.000 ± 0.4977 vs 3.435 ± 0.6794, P = 0.01; CB Ctrl vs 24 h, 1.000 ± 0.1172 vs 2.368 ± 0.3129, P = 0.01, Ctrl vs 72 h, 1.000 ± 0.1172 vs 2.665 ± 0.4765, P = 0.003. Endogenous P2X7 cx, Ctrl vs 8 h, 1.000 ± 0.2918 vs 2.126 ± 0.1471, P = 0.01, Ctrl vs 24 h, 1.000 ± 0.2918 vs 1.908 ± 0.1482, P = 0.03, Ctrl vs 72 h, 1.000 ± 0.2918 vs 2.205 ± 0.4071, P = 0.007; ST Ctrl vs 72 h, 1.000 ± 0.2936 vs 2.681 ± 0.8728, P = 0.04; TH Ctrl vs 8 h, 1.000 ± 0.3256 vs 3.387 ± 0.8902, P = 0.03; CB Ctrl vs 24 h, 1.000 ± 0.08098 vs 1.865 ± 0.2904, P = 0.049, Ctrl vs 72 h, 1.000 ± 0.08098 vs 2.326 ± 0.3095, P = 0.006; n = 4 (Control), 5 (8 and 72 h post-SE), and 6 (24 h post-SE) and representative images displaying P2X7-EGFP mainly localized to Iba-1-positive microglia and Olig-2-positive oligodendrocytes 72 h post- SE in (A) cortex, (B) striatum, (C) cerebellum, and (D) thalamus (n = 3 per group). β-Actin is used as a guide to loading. Scale bars, 50 µm. *P < 0.05, **P < 0.01.

